Download
1 / 18
180 likes | 259 Views
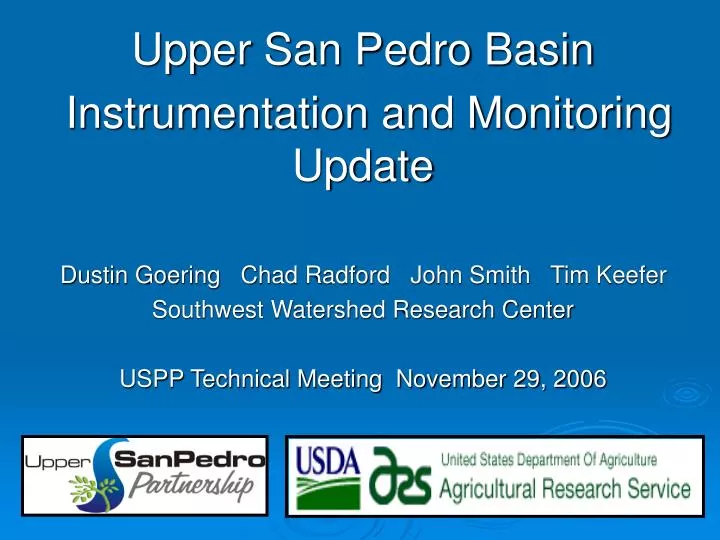
Upper San Pedro Basin Instrumentation and Monitoring Update Dustin Goering Chad Radford John Smith Tim Keefer Southwest Watershed Research Center USPP Technical Meeting November 29, 2006. Overview.

E N D
Upper San Pedro Basin Instrumentation and Monitoring Update Dustin Goering Chad Radford John Smith Tim Keefer Southwest Watershed Research Center USPP Technical Meeting November 29, 2006
Overview In support of USPP and in collaboration with USGS and BLM the USDA-ARS-SWRC is monitoring: San Pedro River flow presence Fort Huachuca and Sierra Vista detention basins USP Basin precipitation at recording raingages Tasks include: Installing and maintaining gages Collecting, checking, archiving data Monitored Data Uses: Water Balance calculation Eco-hydrologic modeling Public Information
Instrumentation & Monitoring: • CURRENT • 8 SP River Flow/Persistence Sites • 5 Detention Basins • 25 Raingages with soil moisture in USPB • FY 2007 • Make available flow, basin and soil data • Based on USPP prioritization: • ~7 Additional Raingages • ~3 Additional Detention Basins
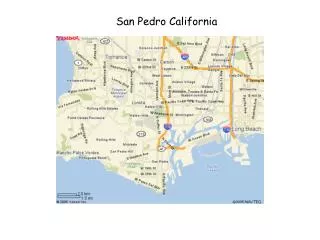
Sierra Vista and Fort Huachuca detention basins SWRC monitoring sites in USPB
Methods for Determining Flow Presence: Pressure Transducers used in the past. Change to occasional photo image at same location as pressure transducers. Monsoon 2006 installed one stationary camera Currently installing stationary “game” cameras that will take daily photos at each of the other 7 monitoring sites.
Issues of Determining Flow Presence: Floods damaged or destroyed pressure transducers in past No control structures to prevent channel from migrating or channel bottom from moving, eroding or depositing sediment River channels migrated away from pressure transducer sites leaving them high and dry River channel cut under PT site where water may pond giving inaccurate “flow” presence
July 2006 August 2006 October 2006 Occasional Photos: Moson Photo Site Issues: Access changes with road/weather conditions Not identical camera position Time/Travel intensive One image ~once every 3-5 days or longer
Stationary Camera: • Installed June 2006 • Boquillas Monitoring Site • Hourly images during daylight • Site visit ~ once per month to collect data and change battery
5 Basins with pressure transducers 4 located on eastern edge of Fort H 1 near Fry & Hwy 92 Data recorded every 15 minutes Download data every 1-3 months No SWRC raingages located within detention basin watersheds – precipitation and basin hydrograph not necessarily linked
Raingage typical installation Elevations range from 3600 to over 7500 feet Data collected daily by radio Solar Panel Data Logger Radio & Modem Soil moisture and temperature capability added in 2006 Rain Collector Load Cell
Rainfall variability for June – October 0.25” to 1.14” ~ 0.3 miles apart 0.5” to 1.3” ~2.3 miles apart Almost no difference in event occurrences and only small difference in event depths at short distances, but adds up over season
Rainfall variability for June – October 0.7” to 3.4” ~7 miles apart 0.0” to 13.1” ~ 30 to 40 miles apart Greater difference in event occurrences and event depths at longer distances
Precipitation event with accompanying soil moisture and temperature
Current Data Availability Preliminary Daily Precipitation: 6:00 am on following day Final QAQC precipitation event: “Breakpoint” event data – time, depth intensity, resolution 1 minute, 0.01” about 2 weeks for QAQC data
2007 Data Availability Soil moisture and temperature: 20 minute intervals about 2 weeks for QAQC data San Pedro Flow: Daily flow presence will be tabulated from archived images. Detention Basin Stage: Stage and volume at 15 minute intervals Both flow and basin data available within 90 days at SWRC website.
Data Availability SWRC ftp site ftp://www-ftp.tucson.ars.ag.gov/DailyReports/Current/USPP/ Daily precipitation SWRC website http://www.tucson.ars.ag.gov/dap/ Checked precipitation, soil moisture and soil temperature, detention basin stage/volume, river flow persistence
Considerations • More raingages associated with detention basins • More raingages on Ft Huachuca 88 acres near La Terreza • Locations of 7 additional raingages • Locations of 3 additional detention basins • Budgetary trade off between more detention basins or raingages