Download
1 / 17
170 likes | 334 Views
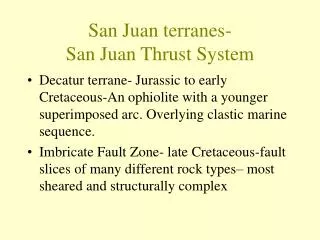
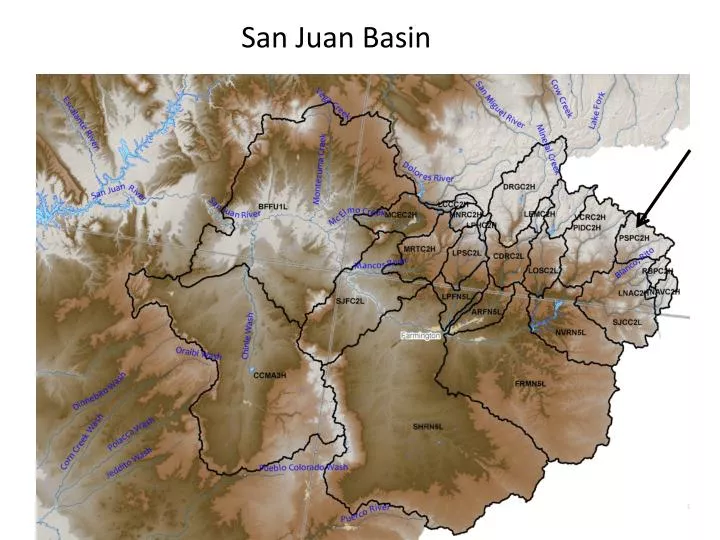
San Juan Basin. San Juan- Pagosa Springs(PSPC2). San Juan- Pagosa Springs(PSPC2). Upper (11000-12644). Middle (8500-11000). Lower (7198-8500). Calibrations/Simulations - inputs. In reality the 3 areas (upper, middle and lower) are represented (simulated) by only 3 points

E N D
San Juan-Pagosa Springs(PSPC2) Upper (11000-12644) Middle (8500-11000) Lower (7198-8500)
Calibrations/Simulations - inputs In reality the 3 areas (upper, middle and lower) are represented (simulated) by only 3 points The inputs our model needs for calibrations and operations (at these 3 points) are: precipitation temperature freezing level
For San Juan River at Pagosa Springs (PSPC2) PSPC2 upper area Elevation = 11437 Area=60nm PSPC2 middle area Elevation = 9774 Area=152nm PSPC2 lower area Elevation = 7844 Area=88nm
Calibrations/Simulations - Precipitation • Each area (upper, middle and lower) MAP is built using precipitation stations that (hopefully) have similar characteristics to that area • For the PSPC2 • Upper area – Upper San Juan.4, Lily Pond.35, Middle Creek.36 • Middle area - Upper San Juan.31, Lily Pond.31, Middle Creek.32 • Lower area - Pagosa Springs 1.06 • These weights were chosen to guarantee water balance in each area. The water balance in each area was calculated using the PRISM sets
San Juan-Pagosa Springs(PSPC2) mdlc2 usjc2 lpdc2 pagc2
Calibrations/Simulations - Temperature • Nearby stations (whose climatology is known) area used to calculate the temperature at the mid-point elevation of the area (whose climatologies are calculated using the climatology of the nearby stations) • Temperature is calculated by using the difference in station and area climatology
Calibrations/Simulations - Inputs • Precipitation and temperature are calculated every six hours at each area within the basin • 30 years • Used to calibrate hydrologic models • Operationally done in a similar way • Ensures our forecasts will have similar quality/characteristics to 30 years of calibration • For the San Juan at Pagosa Springs this is done for the upper, middle and lower areas
Calibrations/Simulations - Models • A snow model (accumulates/ablates snow) is run for each area in the basin • A soil moisture model (controls amount of water from the snow model which is retained in the soil/evaporates or ends up in the stream) is run for each area • Evaporation is a calibrated amount : • E=P-Q
Bare ground or snow cover Precipitation and Air Temperature SNOW ACCUMULATION AND ABLATION MODEL (SNOW-17) Rain or Snow Accumulated Snow Cover Energy Exchange at Snow-Air Interface Areal Extent of the Snow Cover Deficit = 0 Snow Cover Heat Deficit Liquid Water Storage Rain on Bare Ground Ground Melt Transmission of Excess Water Snow Cover Outflow Rain plus Melt
Sacramento Soil Moisture Accounting Model TENSION WATER STORAGE DIRECT RUNOFF UPPER ZONE FREE WATER STORAGE SURFACE RUNOFF INTERFLOW LOWER ZONE PRIMARY FREE WATER STORAGE TENSION WATER STORAGE TENSION WATER STORAGE SUPPLEMENTARY FREE WATER STORAGE BASEFLOW SUBSURFACE OUTFLOW
Calibrations/Simulations • 456 basins • 1130 areas (2-3 per basin) • 85 reservoirs
Calibrations/Simulations - Reservoirs • Reservoir modeling is difficult as they are not physically based. However, we calibratethe reservoir models assumingtwo different modes: • Irrigation (use average releases) • Spillway/passflow • Operationally we do the following: • Assume the current release • Input a schedule • Allow the spill/passflow rules
Adjustments to Flow • Unregulated flow= • Observed flow + Diversions (measured) + Storage • Natural flow= • Unregulated flow + Consumptive Use • Consumptive use (in basin irrigation) can only be estimated • In our simulations we simulate natural flow but subtract out the consumptive use so the output is always unregulated flow • So: • We simulate “natural flow” • We remove the in-basin irrigation (consumptive use) • This is the simulated unregulated flow. It simulates the actual flow plus the measured diversions (adjusted flow) • Operational considerations • Observed flow=Unregulated flow-Diversions-Storage