Download
1 / 41
410 likes | 612 Views
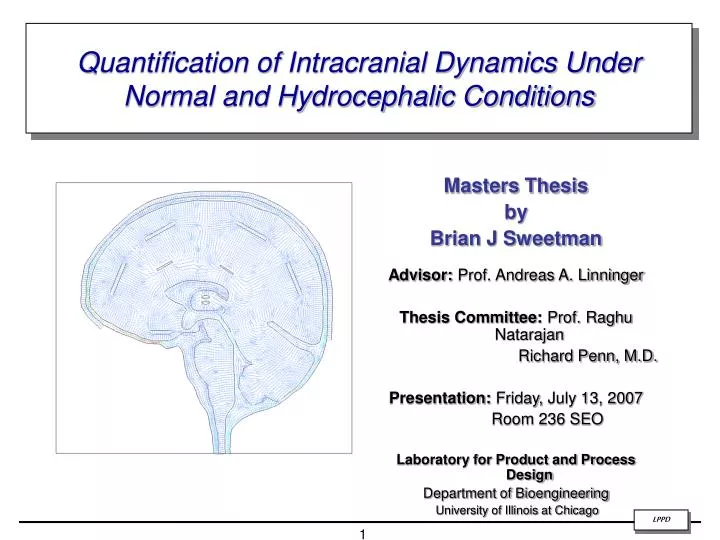
LPPD. Quantification of Intracranial Dynamics Under Normal and Hydrocephalic Conditions. Masters Thesis by Brian J Sweetman Advisor: Prof. Andreas A. Linninger Thesis Committee: Prof. Raghu Natarajan Richard Penn, M.D. Presentation: Friday, July 13, 2007 Room 236 SEO

E N D
LPPD Quantification of Intracranial Dynamics Under Normal and Hydrocephalic Conditions Masters Thesis by Brian J Sweetman Advisor: Prof. Andreas A. Linninger Thesis Committee: Prof. Raghu Natarajan Richard Penn, M.D. Presentation: Friday,July 13, 2007 Room 236 SEO Laboratory for Product and Process Design Department of Bioengineering University of Illinois at Chicago
Outline of Talk Introduction • Patient-specific approach first principles approach in conjunction with computational fluid dynamics to understand intracranial dynamics (ICD) under normal and hydrocephalic conditions • Functions of CSF and definition of intracranial dynamics • Limitations of CINE-phase-contrast-MRI Methods • Reconstruction • Finite element analysis and fluid-structure interaction (FSI) • Linear elasticity and governing equations for flow through a porous medium Results • Linear and poroelastic case studies for normal and hydrocephalic intracranial dynamics • Comparison of normal versus hydrocephalic cerebral spinal fluid (CSF) flow dynamics and pressures throughout the ventricular system Discussion of future work
Hydrocephalus • Clinical signs and symptoms: • Enlarged lateral ventricles and compression of the parenchyma • Increased intracranial pressure (ICP) • -headaches, nausea, vomiting, vision problems • Normal pressure hydrocephalus (NPH) • Free communication throughout the ventricular and subarachnoid space • Dementia, gait disturbance, urinary incontinence Other observed signs: • Marked increase in CSF flow velocities throughout the ventricular system • Increased CSF flow through the lower fourth ventricle • Decreased CSF flow through the cervical region
Hydrocephalus Motivation for Research • Who is affected: • Approximately 1 million Americans • 1 out of 500 children • Elderly • Current treatments: • Pressure shunt and catheter • Third ventriculostomy • Better treatments hampered by: • Lack of understanding of pathophysiology of hydrocephalus • Absence of proper quantification of the mechanical interaction between expanding cerebral vasculature and the soft tissues of the brain. • Lack of knowledge regarding CSF flow and pressure fields
Motivation for Research • Problems with shunts • Cost approximately $1 billion annually in the US • High rate of failure • 41% of hydrocephalus related hospital admissions due to shunt malfunction • Number of replacement surgeries approaches the number of primary surgeries • High mortality rate associated with shunt placement • 3% mortality rate for hydrocephalus related hospital admissions Hydrocephalus Ventricular shunt procedures represent a significant medical and economic problem.
Motivation for Research Fluid-structure interaction (FSI): analysis of transient fluid flow and structural motion. • Interpretation of experiments is inadequate. • In vitro and animal experiments often over simplified and fail to capture physiological phenomenon • In vivo experiments would be invasive and life threatening • FSI for intracranial dynamics • Analysis of saturated tissue deformation under hydrocephalic conditions. • Interaction of vasculature with soft brain tissue. • Quantification of porosity changes in the normal versus hydrocephalic brain. • Fundamental transport processes in soft tissues are poorly understood. • CSF flow velocities (normal vs. hydrocephalic conditions) • Pressure gradients (at present) only attainable through a computational FSI approach Hydrocephalic Brain MRI Normal Brain MRI
Motivation for Research • Quantify observations from clinical analysis • Patient model geometry constructed from MRI data • Identification of CSF flow and pressure gradients • Better understanding of causes of hydrocephalus • Quantification can lead to more effective treatments or prevention • More precise application of shunt implantation • Better understanding of effects of treatment methods including changes in ICD due to shunt
Intracranial dynamics (ICD)—interaction between the solid brain, cerebral spinal fluid (CSF), and blood flow Intracranial Dynamics SAS Lateral ventricles • - CSF flows through ventricles, cerebral and spinal SAS, and the porous parenchyma in a pulsatilemanner • Dynamics of blood and CSF flow result in deformation of brain tissue • MRI provides an incomplete intracranial dynamics profile Goal: use computational fluid dynamics (CFD) to quantify what was previously only understood qualitatively using MRI parenchyma
The brain: Gray and white matter. Vascular system, CSF CSF functions: Transports nutrients important for brain and body function Reduces brain weight by 97% Dampens effects of extra-cranial and intra-cranial forces (acts as cushion) CSF is produced in the choroid plexus at 0.35 ml/min. Hydrocephalus: A condition of formation, flow, or absorption of cerebrospinal fluid (CSF) that leads to an increase in the volume occupied by this fluid in the central nervous system (CNS). Communicating HC: This occurs when full communication exists between the ventricles and subarachnoid space. LPPD Intracranial Dynamics
Solid Parenchyma Cerebrospinal Fluid Fluid Structure Interactions (FSI) in Biological Tissues • CSF flow patterns determined not only by brain geometry and CSF production/reabsorption rates, but also by the dynamic interaction of intracranial fluids and tissues • Brain motion hypothesis –cerebral blood flow causes motion of the solid brain which in turn drives CSF flow • Expansion of the vascular bed causes subsequent changes in the volume of CSF pathways • Transient pressure gradients • Pulsatile pressure-driven reversals of flow FSI Boundary
LPPD Methodology In-Vivo images of the brain MRI Brain Segmentation And Reconstruction Computational Mesh generation Solution of Transport Equations Quantification of CSF dynamics Normal Subject or hydrocephalic patient
Fluid Solid Stresses in solids Stresses in fluids Constitutive equations for fluids and solids Mass x Acceleration = Sum of forces Newton’s Law E Young’s modulus μviscosity
Fluid Solid Stresses in solids Stresses in fluids angular displacement caused by the shearing stress expansion or contraction in the x or y direction caused by Constitutive equations for fluids and solids μviscosity Gshear Young’s modulus
continuity • Avoid singularities in the stress-strain relations for limiting cases ( ) • by replacing the lame’s constant, • with the mean normal stress, • Love, A.E.H., A treatise on the mathematical theory of elasticity, 4th ed., New York: Dover Publications, 1944. • Cirovic S., Walsh C., Fraser W.D., Wave Propagation in a system of coaxial tubes filled with incompressible media: A model of pulse transmission in the intracranial arteries, Journal of Fluids and Structures, vol. 16(8), pp. 1029-1049, 2002. • Xenos M., Somayaji MB.R. and Linninger A.A., Soft-tissue fluid-structure interactions in the human brain, 2nd International Conference “From Scientific Computing to Computational Engineering”, Athens 5-8 July, 2006 x-momentum y-momentum x-displacement y-displacement mass conservation Fluid structure interaction - Problem descriptionin Cartesian coordinates • Fluid Equations in Cartesian coordinates • Solid Equations in Cartesian coordinates
MOVING FLUID and SOLID INTERFACE Moving computational grid, t1 Initial computational grid, t0 f Fluid structure interaction – Basic concepts • Generalized Curvilinear Coordinates • In complex geometries, analytical map is hard to be found (e.g. from Cartesian to polar). • We can approximate the metrics of the transformation with the following finite differences. • with the help of the numerical Jacobian of the transformation we can achieve numerically consistent finite volume treatment. • Moving grid (Eulerian-Langrangian approach) • Time dependent Jacobian (at each time step we evaluate a new Jacobian for each volume) • Contravariant velocities Finite volume grid representation, (a) physical plain, (b) transformed plain
Finite Volume Method for unstructured grids – Gauss theorem Gauss theorem Face flux : The plane profile assumption over the η-face A quadrilateral volume with the normal vectors
Fluid Structure Interactions (FSI) in Biological Tissues • Elements described by assigned empirical parameters: • Material properties (solid) • Young’s Modulus • Poisson’s Ratio • Density • In some cases; Porosity, Permeability • Flow properties (fluid) • Viscosity • Density • Solve differential equations over these elements Using only Newton’s Laws and material properties, physiological phenomena are effectively described FSI Boundary Solid Parenchyma Porous Parenchyma Cerebrospinal Fluid
Porous Brain Model • Brain tissue may be described as poroelastic, consisting of “solid” cell bodies and a permeable extracellular matrix • Described via a poroelastic model with FSI • Brain modeled as a fluid-filled sponge • Brain tissue composed of multiple components • Somas (gray matter) • Axons (white matter) • Interstitial fluid flowing through extracellular matrix and capillaries • Presence of pulsating arteries and blood/CSF mixing • Impose boundary conditions such as inflow from choroid plexus and permeability into porous parenchyma • Quantify ventricular enlargement due to • Pulse pressure • Influence of spinal canal • Verify results by comparing with MRI flow data • patient specific geometry needed for more accurate results
What was analyzed Intracranial dynamics under normal conditions Linear Elastic and Poroelastic Case Studies • Expansion of arterial system leading to clinically measured CSF velocities in the normal subject Intracranial dynamics under hydrocephalic conditions Linear Elastic and Poroelastic Case Studies • Increased ventricular size leads to changes in the CSF flow dynamics (velocities, pressure gradients) • Displacements were applied to obtain clinically observed CSF flow velocities
Overview of Linear elastic model v=0.3 E=10kPa • Arterial expansion: • cortex, upper ventricular wall, upper and lower thalamus, and lower parenchyma (arrows not drawn to scale) v=0.3 E=10x106 Pa FSI boundary in black • 0.35 ml/min CSF inflow velocity • Fluid properties: • Density: 1,000 kg/m3 • Viscosity: 0.001kg/ms v=0.3 E=1x10⁶ Pa v=0.3 E=1x10⁵ Pa
Overview of Poroelastic model Solid Model Fluid Model
Overview of LE model (HC) • Arterial expansion: • upper ventricular wall, upper and lower thalamus (arrows not drawn to scale) v=0.3 E=10kPa FSI boundary in black • 0.35 ml/min CSF inflow velocity • Fluid properties: • Density: 1,000 kg/m3 • Viscosity: 0.001kg/ms v=0.3 E=10x106 Pa v=0.3 E=1x10⁶ Pa v=0.3 E=1x10⁵ Pa
Overview of PE model (HC) Solid Model Fluid Model *Note: a lower permeability at the sagittal sinus was used for the HC cases
LV AV3 V3 AV4 V4 LV4 Locations of measurement Normal Subject Hydrocephalic Patient
Velocity Profiles (LE Normal) *Differences in the PE/LE cases are a function of the displacement boundary conditions (pg. 56/61 Thesis)
CFD v. MRI at LV4 LV 8 6 CFD MRI 4 AV3 2 CSF Velocity [mm/s] V3 0 0.00 0.20 0.40 0.60 0.80 1.00 -2 AV4 V4 -4 LV4 -6 Flow Rate through LV4 0.25 -8 0.20 Time [% Cardiac Cycle] LV4 0.15 0.10 0.05 CSF Flow Rate [cc/s] 0.00 0.00 0.20 0.40 0.60 0.80 1.00 -0.05 -0.10 -0.15 -0.20 -0.25 Time [% Cardiac Cycle] MRI Validation of CSF flow velocities Stroke volume through LV4: 0.049 ml
Velocity at AV3 30 AV3 20 10 CSF Velocity [mm/s] 0 0.00 0.20 0.40 0.60 0.80 1.00 -10 -20 -30 Time [% Cardiac Cycle] Prediction of CSF flow velocities • MRI can not resolve velocity profiles in the aqueduct of Sylvius due to its small diameter • The first principles approach is capable of predicting velocities in areas such as the aqueduct of Sylvius, subarachnoid space, and spinal canal AV3
Pressure profiles (LE Normal) • Pressure profiles throughout the ventricular system and subarachnoid space Transmantle pressure gradient does not exceed 23 Pa [agrees with experimental findings] Pressure gradient between AV3 and AV4 is 1.10 Pa at AV3 velocity maximum [agrees with Jacobson et al.]
Normal Subject-Pulsatility LE Normal PE Normal Pulsatility = 135 Pa Pulsatility = 101 Pa *It has been observed that pulsatility in normal subjects less than in hydrocephalic patients [Czosnyka et. al., 2004]
Flux into the spinal canal • CSF is forced out of the ventricular system and into the spinal canal or through the sagittal sinus during systole. • S-I stroke volume is calculated by integrating A*v*dt • A is the cross sectional area of the cranio-cervical junction (at the level of C2) • v is the CSF velocity exiting the brain S-I stroke volume was 0.49 ml for both the LE and PE Normal Case studies
Normal brain Comparison: Cine MRI – FSI-CFD CSF velocity vectors from MRI CSF velocity vectors from FSI-CFD simulation
Velocity Profiles (LE Hydrocephalic) Stroke volume through LV4 is 5 times greater in the hydrocephalic case
Pressure profiles (LE HC) • Pressure profiles throughout the ventricular system and subarachnoid space Transmantle pressure gradient does not exceed 96 Pa Pressure gradient between AV3 and AV4 is 0.35 Pa at AV3 velocity maximum
Pulsatility-LE HC LE Hydrocephalic PE Hydrocephalic Pulsatility = 228 Pa Pulsatility = 162 Pa *Pulsatility is 68% higher than in normal case. Lower pulsatility in PE case due to reduced arterial expansion (to obtain lower stroke volume into spinal canal).
Flux into the spinal canal • CSF is forced out of the ventricular system and into the spinal canal or through the sagittal sinus during systole. • S-I stroke volume is calculated by integrating A*v*dt • A is the cross sectional area of the cranio-cervical junction (at the level of C2) • v is the CSF velocity exiting the brain S-I stroke volume was 0.48 ml for the LE and 0.28 ml for the PE Hydrocephalic Case studies C2
Normal brain Comparison: Cine MRI – FSI-CFD CSF velocity vectors from MRI CSF velocity vectors from FSI-CFD simulation
Parenchymal Stress Compressive and tensile stresses in the normal and hydrocephalic case when fluid is reentering the lateral ventricles • Compressive stress in blue/green • Tensile stresses in red/orange
Conclusions • Patient-specific soft tissue fluid-structure interaction models that validate MRI flow data were presented. These models are used to predict fluid-tissue interactions in normal and pathological conditions (hydrocephalus). • Both linear elastic and poroelastic models were shown to provide valuable insight into the processes of normal and hydrocephalic intracranial dynamics • The models accurately predict flow velocities throughout the ventricular system. • Stroke volumes in the cranio-cervical junction and lower fourth ventricle are predicted by the model. LV4 stroke volume is in close agreement with MRI data. • The model predicts pressure gradients throughout the ventricular system, subarachnoid space, and spinal canal (MRI can only provide velocity data) • The poroelastic model is useful in visualizing regions of compressive and tensile stress, and therefore in predicting areas where brain porosity changes significantly (due to pressure applied at the ventricular wall). This model gives the opportunity to design new treatments and predict pathologies without the need of in vivo testing of the patients.
Future Work • The poroelastic model will be examined in greater depth to quantify the porosity change in the normal versus hydrocephalic patient. • Affects of changes in material properties could be analyzed • Compliance of spinal canal • Permeability through the sagittal sinus • Boundary conditions can be introduced that may lead to a hydrocephalic state over time
LPPD Acknowledgements Advisor: Andreas Linninger, PhD, Director of LPPD, Associate Professor, Department of Bioengineering, UIC Committee Members: Raghu Natarajan, Phd, Professor, Department of Bioengineering, UIC Richard Penn, MD, Professor,Department of Neurosurgery, University of Chicago • Michalis Xenos, Post Doctoral Research Associate, Department of Chemical Engineering, UIC • MahadevaBharath Somayaji, PhD candidate, Department of Chemical Engineering, UIC • Xiaodong Guo, PhD, Post Doctoral Research Associate, University of Chicago • Mike Castelle, University of Chicago • LPPD Members: • Libin Zhang, PhD,Research Assistant Professor, Department of Chemical Engineering, UIC • Monil Shah, Masters Candidate, Department of Bioengineering, UIC • Kedar Kulkarni, PhD candidate,,Department of Bioengineering, UIC • Jeonghwa Moon, PhD candidate, Department of Chemical Engineering, UIC