Download
1 / 39
410 likes | 629 Views
Social tolerance under “harsh” conditions. Anna Nemirovskaya Siberian Federal University Krasnoyarsk. Social tolerance under harsh conditions Key Question :

E N D
Social tolerance under “harsh” conditions Anna Nemirovskaya Siberian Federal University Krasnoyarsk
Social tolerance under harsh conditions Key Question: The aim is to address the problem of social tolerance in societies under harsh, or difficult, conditions, such as poverty, low quality of life, considerable social differentiation, political instability, state of war and other deprivation circumstances. This study could enrich the understanding of social tolerance through a cross-country analysis and exploration of relationships between WVS data on tolerance and other sociological and statistical data, including a number of global indices. At the current stage, this exploratory research is intended to define, using statistical analysis, more close focus on particular aspects of social tolerance, its inner structure and variation in cross-country comparison. The scope of the project: • Cross-country view (using WVS database) • Within-country view (using regional and local comparable data) – in perspective. The first attempt – a survey in the Krasnoyarsk Territory (March 2011, N = 1250 respondents) with the same indicators on tolerance and independent variables as in the cross-country project.
Core Variables and Hypotheses: The research is intended to explore the structure of social tolerance and its` correlation with quality of life, life satisfaction, social optimism, existential security, social status, social identity etc. using WVS data, at the cross-country level. The central hypothesis is that there is a strong relationship between social tolerance and the degree to which the respondents` life conditions are depriving in a broad sense. Previous research has demonstrated that respondents` level of income, well-being, social status, region of residence, values, nationality, and other important characteristics are significantly related to social tolerance. For comparison and testing of the hypotheses, this research employed a number of variables from WVS database, demonstrating social and economic status of a respondent. In order to prove the hypotheses, several additional independent variables were applied. For example, indexes based on national statistics, that can act as indicators of difficult conditions within a country or low level of its development: GDP per capita, GNI per capita, life expectancy at birth, intentional homicide rate, robbery rate. One of the objectives of the research is to study the relationship between WVS data and a number of global indices. It will help to define and explain the level of social tolerance in the countries, that are in harsh conditions, undeveloped, oppressed, non-democratic, corrupted, post- or current colonial countries and regions, countries in the state of war etc.
Analyses and Modelling: Correlation analysis, logistic regression, discriminant analysis, optimal scaling, multidimensional scaling, factor analysis, cluster analysis will be applied in this research. Targeted Data Base: To test the research question, the World Values Survey data, a number of global indices, World Bank, UN and national demographic and social statistics has been used. Social tolerance is a complex, multidimensional concept, which is difficult to measure, yet it has been investigated and discussed in sociological literature since 1960-ies. The conceptions of tolerance, its schemes and measurement vary a lot. This project will try to add to the conversation. First, I will briefly place this report into the conversation why tolerance is important, how it can be defined and measured. Second, I`d like to present a simple model that shows that my approach is one valid attempt to tolerance measurement. Third, the comparative cross-cultural data on social tolerance, based on 3 indices will be presented (index on factor scores and the single index described in sociological literature on the topic are presented. Fourth, some results of investigation of correlations between social tolerance level and different indicators of harsh conditions as well as socio-demographic factors will be demonstrated. Finally, I`d like to discuss suggestions and possible ideas for further work on measuring social tolerance.
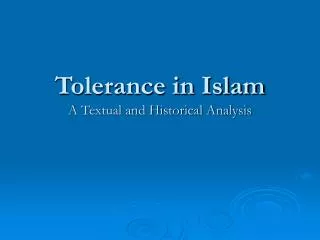
What is social tolerance? In general, tolerance is an acceptance of others with mutual respect and understanding. The UN’s Declaration of Principles on Tolerance defines tolerance as “an active attitude” and a “responsibility that upholds human rights, pluralism (including cultural pluralism), democracy and the rule of law”. • social tolerance • political tolerance • religious tolerance • intercultural tolerance • crime and deviance tolerance • homosexual tolerance, etc. Tolerance, as well as trust and networks, plays a great role in social capital formation. Along with trust, subjective well-being, political activism and self-expression, tolerance is intrinsic to post-industrial societies with high levels of existential security. (R. Inglehart, C. Welzel) The study of tolerance in modern and changing world is a topical issue for social sciences. It is interesting to look at a kind of discourse analysis made with the help of the Google Books Ngram Viewer service, which displays a graph showing how those particular phrases have occurred in a corpus of books over the selected years. The tables below show the frequency of occurrence of tolerance concept in the English and Russian languages discourse. As we can see from the charts, the highest request for tolerance in English-language literature was in late 1980-ies, while Russian authors paid the most attention to this concept in early 2000-s.
Abrahamson, M., Carter, V.J. Tolerance, Urbanism and Region. American Sociological Review, Vol. 51, No. 2 (Apr., 1986), pp. 287-294. • Andersen R., Fetner T. Cohort Differences in Tolerance of Homosexuality: Attitudinal Change in Canada and the United States, 1981-2000. The Public Opinion Quarterly, Vol. 72, No. 2 (Summer, 2008), pp. 311-330. • Andersen R., Fetner T. Economic Inequality and Intolerance: Attitudes toward Homosexuality in 35 Democracies. American Journal of Political Science, Vol. 52, No. 4 (Oct., 2008), pp. 942-958. • Anderrsen D.E. The Social Importance of Tolerance. Cosmos and Taxis blog. May 16, 2009. • Bjørnskov, C. Inequality, tolerance and growth. University of Aarhus, Aarhus School of Business, Department of Economics, 2004. Working Paper 04-8. • Bornschier, V. Trust and Tolerance – Enabling Social Capital Formation for Modern Economic Growth and Societal Change. Paper prepared for the conference at the University of Technology, Sidney, Australia, December 14-16, 2000, on "Organizing Knowledge Economies and Societies", organized by APROS . • Das J., DiRienzo C., Tiemann T. A Global Tolerance Index. Competitiveness Review: An International Business Journal. Vol. 18 No 3, 2008. pp. 192-205. • Duch, R.M., Taylor, M.A. Postmaterialism and the Economic Condition. American Journal of Political Science, Vol. 37, No. 3 (Aug., 1993), pp. 747-779. • Gibson, J. (2006). Enigmas of Intolerance: Fifty Years after Stouffer's Communism, Conformity, and Civil Liberties. Perspectives on Politics 4(01): 21-34. • Gibson, J.L., Gouws, A. Making Tolerance Judgments: The Effects of Context, Local and National. The Journal of Politics, Vol. 63, No. 4 (Nov., 2001), pp. 1067-1090. • Grabb E.G. Working-Class Authoritarianism and Tolerance of Outgroups: A Reassessment. The Public Opinion Quarterly, Vol. 43, No. 1 (Spring, 1979), pp. 36-47.
Guérin, D., Pelletier R. (2000). Cultural Nationalism and Political Tolerance in Advanced Industrial Societies: The Basque country and Catalonia. Nationalism and Ethnic Politics 6(4): 1-22. • Guerin, D., Petry F., et al. (2004). Tolerance, Protest and Democratic Transition: Survey Evidence from 13 Post-communist Countries. European Journal of Political Research 43(3): 371-395. • Harell A. The Micro-story of Multiculturalism: Diverse Social Networks and the Socialization of Tolerance. PHD Thesis. McGill University (Canada), 2008. 250 p. • Hodson, R., Sekulic, D., Massey, G. National Tolerance in the Former Yugoslavia. The American Journal of Sociology, Vol. 99, No. 6 (May, 1994), pp. 1534-1558. • Human Beliefs and Values. A cross-cultural sourcebook based on the 1999-2002 values surveys. Ed. by R. Inglehart, M. Basanez, J. Diez-Medrano, L. Halman and R.Luijkx. • Hutchison, M., Gibler D. (2007). Political Tolerance and Territorial Threat: A Cross National Study. Journal of Politics 69(1): 128-142. • Iglič, H. Voluntary Associations and Tolerance: An Ambiguous Relationship. American Behavioral Scientist January 2010 vol. 53 no. 5 717-736. • Inglehart, R. The New Europeans: Inward or Outward-Looking? International Organization, Vol. 24, No. 1 (Winter, 1970), pp. 129-139. • Inglehart R., Basánez M., Díez-Medrano J., Halmann L. and Luijkx R. (eds.) 2004: Human Beliefs and Values. A cross-cultural sourcebook based on the 1999-2002 values surveys. Coyoacan: sigloveintiunoeditores. • Inglehart, R., Moaddel M. and Tessler M. Xenophobia and In-Group Solidarity in Iraq: A Natural Experiment on the Impact of Insecurity. Perspectives on Politics, Vol. 4, No. 3 (September, 2006), pp. 495-506.
Inglehart, R., Wayne E. Baker. 2000. Modernization, Cultural Change, and the Persistence of Traditional Values. American Sociological Review. 2010. 65(1): 19-51. • Inglehart R., Welzel C. Modernization, Cultural Change and Democracy. New York: Cambridge University Press, 2005. • Katnik, A. Religion, Social Class and a Political Tolerance: A Cross-national Analysis. International Journal of Sociology. Spr 2002. Vol. 32. Issue 1. P. 14-38. ISSN 0020-7Kehberg J.E. Public Opinion on Immigration in Western Europe: Economics, Tolerance, and Exposure. Comparative European Politics, 2007, 5, (264 - 281). • Login, A., Areas S. (2007). Public Opinion on Immigration in Western Europe: Economics, Tolerance, and Exposure. Comparative European Politics 5: 264-281. • Middleton, R. Regional Differences in Prejudice. American Sociological Review. 1976. 41:94-117. • Mueller, J. Trends in Political Tolerance. The Public Opinion Quarterly, Vol. 52, No. 1 (Spring, 1988), pp. 1-25. • Navas, S. La idea liberal de tolerancia en las democracias actuales. Política y Cultura, primavera 2004, num. 21, pp. 37-56. • Neeleman, J., Halpern D., et al. (1997). Tolerance of Suicide, Religion and Suicide Rates: an Ecological and Individual Study in 19 Western Countries. Psychological Medicine 27(5): 1165. • Peffley, M., Rohrschneider R. (2003). Democratization and Political Tolerance in Seventeen Countries: A Multi-level Model of Democratic Learning. Political Research Quarterly 56(3): 243. • Pettinicchio, D., Robbins, B., 2008-11-11 "Social Capital, Tolerance for Deviance and Civic Action: Explaining Homicide Rates across 57 Nations" Paper presented at the annual meeting of the ASC Annual Meeting, St. Louis Adam's Mark, St. Louis, Missouri Online.
Schatz, M.S. Social Tolerance and Social Civility: Key Elements for Transitioning Democratic Countries. Journal of Comparative Social Welfare, 1748-684X, Volume 20, Issue 1, 2004, Pages 23-31. • Stouffer, S. Communism, Conformity and Civil Liberties. Garden City, NJ: Doubleday, 1955. • Sullivan J.L., Marcus G.E., Feldman S., Piereson J.E. The Sources of Political Tolerance: A Multivariate Analysis. The American Political Science Review, Vol. 75, No. 1 (Mar., 1981), pp. 92-106. • Sullivan, J., Transue J. (1999). The Psychological Underpinnings of Democracy: A Selective Review of Research on Political Tolerance, Interpersonal Trust, and Social Capital. Annual Reviews in Psychology 50(1): 625-650. • Tausch A. Index of Global Tolerance: a Quantitative Analysis based on 'World Values Survey' Data. Published in: WIIW Monthly Report No. 1/2009 Arno Tausch. Index of Global Tolerance: a Quantitative Analysis based on 'World Values Survey' Data. Published in: WIIW Monthly Report No. 1/2009. • The End of Tolerance: Engaging Cultural Differences. Eds. Richard Shweder, Martha Minow and Hazel Rose Markus. Daedalus, Number 129, Volume 4, Fall 2000. • Tuch, S.A. Urbanism, Region, and Tolerance Revisited: The Case of Racial Prejudice. American Sociological Review, Vol. 52, No. 4 (Aug., 1987), pp. 504-510. • Wade Smith, A. Racial Tolerance as a Function of Group Position. American Sociological Review, Vol. 46, No. 5 (Oct., 1981), pp. 558-573. • Watkins, J. Contextual-and Individual-level Determinants of Political Tolerance in Developing Countries. A Senior Scholars Thesis. Texas A&M University, April 2007. • Welzel A. Are levels of Democracy Affected by Mass Attitudes7 Testing Attainment and Sustainment Effects on Democracy. International Political Science Review (2007), Vol. 28, No. 4, 397-424.
Weldon S.A. The Institutional Context of Tolerance for Ethnic Minorities: A Comparative, Multilevel Analysis of Western Europe. American Journal of Political Science, Vol. 50, No. 2 (Apr., 2006), pp. 331-349. • Wirth, L. Urbanism as a Way of Life. American Journal of Sociology. 1938. 44:1-24. The concept of social tolerance has been studied in various aspects, within different theoretical frames, but the most common and relevant to the cross-country level research are the modernization theory, revised by R. Inglehart and the conception of social capital. Investigation of regional, within-country aspects of social tolerance will also require other theoretical approaches, as the reasons and factor of national tolerance and intolerance are varied and very cultural specific.
Social tolerance is assessed by World Values Survey`s question “On this list are various groups of people. Could you please sort out any that you would not like to have as neighbors?” 6 indicators on tolerance, asked in the interview in most countries in all waves: A124-01.- Neighbours: People with a criminal record; A124-02.- Neighbours: People of a different race; A124-03.- Neighbours: Heavy drinkers; A124-04.- Neighbours: Emotionally unstable people; A124-05.- Neighbours: Muslims; A124-06.- Neighbours: Immigrants/foreign workers; 9 indicators on tolerance asked in 48 countries in the 5th wave: A124-02.- Neighbours: People of a different race; A124-03.- Neighbours: Heavy drinkers; A124-06.- Neighbours: Immigrants/foreign workers; A124-07.- Neighbours: People who have AIDS A124-08.- Neighbours: Drug addicts A124-09.- Neighbours: Homosexuals A124-12.- Neighbours: People of a different religion A124-42.- Neighbours: Unmarried couples living together A124-43.- Neighbours: People who speak a different language
Factor analysis, Varimax all waves, 6 variables:
Univariate Analysis of Variance (dependent variable – tolerance index based on factor scores, 6 variables, all waves) • Sex R Squared = 0,000 • Income level R Squared = 0,001 • How proud of nationality R Squared = 0,001 • Wave R Squared = 0,003 • Religious person R Squared = 0,003 • Age R Squared = 0,004 • Feeling of happiness R Squared = 0,005 • State of health R Squared = 0,005 • Satisfaction with financial situation of household R Squared = 0,005 • Job satisfaction R Squared = 0,005 • Social class (subjective) R Squared = 0,006 • Self-positioning in political scale R Squared = 0,008 • Satisfaction with your life R Squared = 0,013 • Post-Materialist index 4 item R Squared = 0,017 • Profession/job R Squared = 0,023
Country/region and Social class (subjective) R Squared = 0,125 • Country/region and Income level R Squared = 0,160 • Country/region R Squared = 0,169 • Country/region and Sex R Squared = 0,171 • Country/region and Satisfaction with financial situation of household R Squared = 0,173 • Country/region and How proud of nationality R Squared = 0,175 • Country/region and Post-Materialist index 4 item R Squared = 0,176 • Country/region and State of health R Squared = 0,176 • Country/region and Satisfaction with your life R Squared = 0,179 • Country/region and Feeling of happiness R Squared = 0,183 • Country/region and Self-positioning in political scale R Squared = 0,184 • Country/region and Wave R Squared = 0,189 • Country/region and Religious person R Squared = 0,196 • Country/region and Profession/job R Squared = 0,198 • Country/region and Age R Squared = 0,220 • Country/region and Job satisfaction R Squared = 0,244
Global Tolerance Index was originally designed by Richard Florida for 45primarily western countries by using responses on the World Values Survey. GTI is comprised of two sub-indices, the “Values Index” and the “Self-Expression Index”. In 2008 GTI was enhanced by additional data (62 countries in total) by J. Das, C. DiRienzo and T. Tiemann. Their findings support and extend those of Florida (2002) and Florida and Tingali (2004) as they find that more tolerant countries have greater net immigration, adding more heterogeneity. They also find that more tolerant countries have higher GDP per capita, and score higher on the Human Development Index and the Global Competitiveness Index.
The Legatum Prosperity Index assesses 110 countries, accounting for over 90 percent of the world’s population, and is based on 89 different variables, each of which has a demonstrated effect on economic growth or on personal wellbeing. The Prosperity Index is a global index that seeks to understand how economic fundamentals, health, freedom, governance, safety, education, entrepreneurial opportunity, and social capital influence a country’s economic growth and the happiness of its citizens. It finds that successful countries enjoy a “virtuous cycle” of economic liberty and growth, political freedom and good governance, and enterprising and happy citizens, which mutually reinforce each other on the path to prosperity. The Index consists of eight sub-indexes, each of which represents a fundamental aspect of prosperity: 1. Economy; 2. Entrepreneurship & Opportunity (E&O); 3. Governance; 4. Education; 5. Health; 6. Safety & Security; 7. Personal Freedom and 8. Social Capital. Each sub-index assesses the effect of a range of variables on per capita GDP and the subjective wellbeing of citizens. In this way, the Prosperity Index allows us to discover the non-economic effects of economic reality, and the effects of economic indicators on life satisfaction.
Human Development Index (HDI), a composite statistic used to rank countries by level of "human development" and separate developed (high development), developing (middle development), and under-developed (low development) countries. The statistic is composed from data on life expectancy, education and per-capita gross national income (as an indicator of standard of living) collected at the national level. It is important, that the concept of human development focuses on the ends rather than the means of development and progress. As UNDP claims, the real objective of development should be to create an enabling environment for people to enjoy long, healthy and creative lives. Thus, human development denotes both the process of widening people's choices and improving their well-being. The most critical dimensions of human development are: a long and healthy life, knowledge and a decent standard of living. Additional concerns include social and political freedoms. The concept distinguishes between two sides of human development. One is the formation of human capabilities, such as improved health or knowledge. The other is the enjoyment of these acquired capabilities, for work or for leisure.
The Failed States Index is an annual ranking of 177 nations based on their levels of stability and capacity. First published in 2005, the Failed States Index continues to be a globally recognized, frequently cited and widely praised research product of an independent non-governmental organization that addresses key 21st century international security challenges. The index's ranks are based on twelve indicators of state vulnerability - four social, two economic and six political. The indicators are not designed to forecast when states may experience violence or collapse. Instead, they are meant to measure a state's vulnerability to collapse or conflict. Social indicators: demographic pressures, massive movement of refugees and internally displaced peoples, legacy of vengeance-seeking group grievance, chronic and sustained human flight. Economic indicators: uneven economic development along group lines, sharp and/or severe economic decline. Political indicators: criminalization and/or delegitimisation of the state, progressive deterioration of public services, widespread violation of human rights, security apparatus as ‘state within a state’, intervention of other states or external factors.
Gross domestic product (GDP) per capita (2008 PPP US$) refers to the market value of all final goods and services produced within a country in a given period. It is often considered an indicator of a country's standard of living. The GDP dollar estimates are derived from purchasing power parity (PPP) calculations. Purchasing power parity (PPP) GDP is GDP converted to constant international dollars using PPP rates. An international dollar has the same purchasing power over GDP that a U.S. dollar has in the United States. Using a PPP basis is arguably more useful when comparing generalized differences in living standards on the whole between nations because PPP takes into account the relative cost of living and the inflation rates of the countries, rather than using just exchange rates which may distort the real differences in income. Gross national income (GNI) per capita (constant 2008 PPP US$). Gross national income comprises the total value produced within a country (i.e. its gross domestic product), together with its income received from other countries notably interest and dividends), less similar payments made to other countries.The GNI consists of: the personal consumption expenditures, the gross private investment, the government consumption expenditures, the net income from assets abroad (net income receipts), and the gross exports of goods and services, after deducting two components: the gross imports of goods and services, and the indirect business taxes. The GNI is similar to the gross national product (GNP), except that in measuring the GNP one does not deduct the indirect business taxes.
The Happy Planet Index (HPI) is an index of human well-being and environmental impact that was introduced by the New Economics Foundation (NEF) in July 2006. The index is designed to challenge well-established indices of countries’ development, such as Gross Domestic Product (GDP) and the Human Development Index (HDI), which are seen as not taking sustainability into account. In particular, GDP is seen as inappropriate, as the usual ultimate aim of most people is not to be rich, but to be happy and healthy. Furthermore, it is believed that the notion of sustainable development requires a measure of the environmental costs of pursuing those goals. The HPI is based on general utilitarian principles — that most people want to live long and fulfilling lives, and the country which is doing the best is the one that allows its citizens to do so, whilst avoiding infringing on the opportunity of future people and people in other countries to do the same. In effect it operationalises the IUCN's (World Conservation Union) call for a metric capable of measuring 'the production of human well-being (not necessarily material goods) per unit of extraction of or imposition upon nature'. Each country’s HPI value is a function of its average subjective life satisfaction, life expectancy at birth, and ecological footprint per capita. The exact function is a little more complex, but conceptually it approximates multiplying life satisfaction and life expectancy, and dividing that by the ecological footprint. Most of the life satisfaction data is taken from the World Values Survey and World Database of Happiness, but some is drawn from other surveys, and some is estimated using statistical regression techniques.
The Democracy Index is an index compiled by the Economist Intelligence Unit that claims to measure the state of democracy in 167 countries, of which 166 are sovereign states and 165 are UN member states. The Economist Intelligence Unit's Democracy Index is based on 60 indicators grouped in five different categories: electoral process and pluralism, civil liberties, functioning of government, political participation and political culture. The five categories are interrelated and form a coherent conceptual whole. The condition of having free and fair competitive elections, and satisfying related aspects of political freedom, is clearly the basic requirement of all definitions.
The HumanPoverty Index is anindication of the standard of living in acountry, developedby the United Nations. Forhighlydevelopedcountries, the UN considersthatitcanbetterreflect the extent of deprivationcompared to the Human Development Index. The HumanDevelopmentReportswebsitesummarizesthisas "A compositeindexmeasuringdeprivations in the threebasicdimensionscaptured in the humandevelopmentindex – alongandhealthylife, knowledgeandadecentstandard of living." The Oxford Poverty and Human Development Initiative (OPHI) of Oxford University and the Human Development Report Office of the United Nations Development Programme (UNDP) launched in July 2010 a new poverty measure that gives a “multidimensional” picture of people living in poverty which its creators say could help target development resources more effectively. The MultidimensionalPoverty Index (MPI) supplants the Human Poverty Index, which had been included in the annual Human Development Reports since 1997. Like development, poverty is multidimensional — but this is traditionally ignored by headline figures. The Multidimensional Poverty Index (MPI), published for the first time in the 2010 Report, complements money-based measures by considering multiple deprivations and their overlap. The index identifies deprivations across the same three dimensions as the HDI and shows the number of people who are poor (suffering a given number of deprivations) and the number of deprivations with which poor households typically contend.
The Gender Inequality Index (GII). The disadvantages facing women and girls are a major source of inequality. All too often, women and girls are discriminated against in health, education and the labor market – with negative repercussions for their freedoms. We introduce a new measure of these inequalities built on the same framework as the HDI and the IHDI – to better expose differences in the distribution of achievements between women and men. Countries with unequal distribution of human development also experience high inequality between women and men, and countries with high gender inequality also experience unequal distribution of human development. The Global Peace Index (GPI) is an attempt to measure the relative position of nations' and regions' peacefulness. It is the product of Institute for Economics and Peace and developed in consultation with an international panel of peace experts from peace institutes and think tanks with data collected and collated by the Economist Intelligence Unit. The list was launched first in May 2007, then continued on May 2008, 2 June 2009, and most recently 10 June 2010. It is claimed to be the first study to rank countries around the world according to their peacefulness. It ranks 149 countries (up from 121 in 2007). Factors examined by the authors include internal factors such as levels of violence and crime within the country and factors in a country's external relations such as military expenditure and wars.
Life expectancy at birth (years), 2006. Intentional homicide, rate per 100,000 population. Source: International Homicide Data. United Nations Office on Drugs and Crime. UNODC Homicide Statistics are drawn from both international and national sources. Sources used include both criminal justice and public health statistics. Data obtained from public health and law enforcement institutions measure slightly different phenomena and are therefore unlikely to provide identical numbers. Robbery rate – amount of property crime that involves the use of violence or threat of violence, including mugging, bag snatching and theft with violence, expressed per 100,000 people. Death rate, crude (per 1,000 people). Crude death rate indicates the number of deaths occurring during the year, per 1,000 population estimated at midyear. Subtracting the crude death rate from the crude birth rate provides the rate of natural increase, which is equal to the rate of population change in the absence of migration. Prevalence of HIV, total (% of population ages 15-49) refers to the percentage of people ages 15-49 who are infected with HIV.
The structure of social tolerance, WVS, 5th wave: factors and their correlation according to oblimin factor analysis of global indices (in total 91% of variation is explained)
Results at this stage: • different computing experiments have been done, in order to design, apply and test several indices on tolerance. • with different combinations of methods and indices, the concept of tolerance at cross-country level has been described. • ties and correlations between different aspects of tolerance have been estimated. • social tolerance is proved as a complex phenomenon, requiring analysis at both cross-country and inter-country levels. • social tolerance may be investigated and explained in terms of system approach. Prospective plans: The next step is to create a multilevel model of social tolerance, taking social class, income level, satisfaction with life, feeling of happiness, religion, profession, age, sex, state of health and job satisfaction as independent variables, as using global indices and national statistics on “harsh conditions” as country predictors. Then, using the data from different waves of WVS, it is also possible to study the dynamics of tolerance at global, cross-country level. In perspective, a model of social tolerance, explaining general laws and functioning of this phenomenon, might be developed.