Download
1 / 75
750 likes | 864 Views
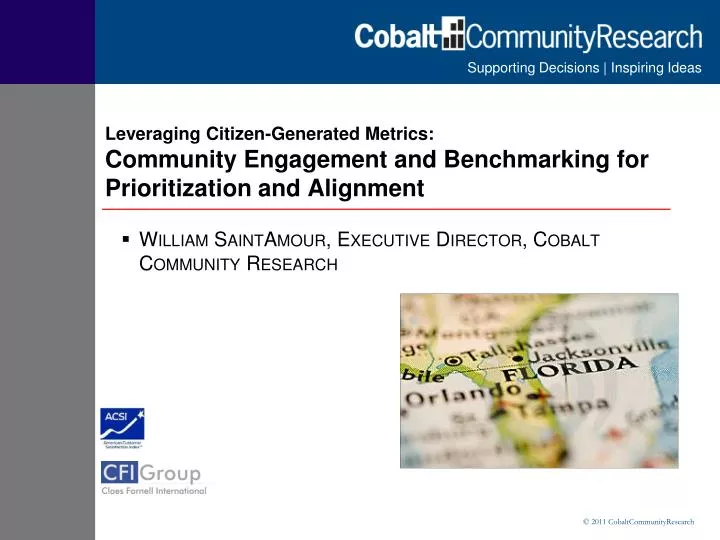
Supporting Decisions | Inspiring Ideas. Leveraging Citizen-Generated Metrics: Community Engagement and Benchmarking for Prioritization and Alignment. William SaintAmour, Executive Director, Cobalt Community Research. Agenda. Introduction Benchmarking: hard and soft metrics

E N D
Supporting Decisions | Inspiring Ideas Leveraging Citizen-Generated Metrics: Community Engagement and Benchmarking for Prioritization and Alignment William SaintAmour, Executive Director, Cobalt Community Research
Agenda • Introduction • Benchmarking: hard and soft metrics • Qualitative metrics • Quantitative metrics • Cobalt Citizen Engagement and Priority Assessment • Other resources
Audience Response System • Your responses are anonymous, and they are important. • Respond by holding down the number of your choice. After you push the button, a small light should flash and turn green. • Resist pushing the “go” button or your answers will not be recorded. The “?” button is not set for this presentation. • The results will be tabulated on the screen. • Please leave your keypads at the table when you leave.
Where is your municipality located? • Region 1 • Region 2 • Region 3 • Region 4 • Region 5 :10
About Cobalt Community Research • 501c3 not-for-profit research coalition • Offered to address stakeholder pressures facing schools, local governments and nonprofit organizations • Uses the science behind the University of Michigan’s respected American Customer Satisfaction Index (ACSI)
American Customer Satisfaction Index (ACSI) • Only global indicator of customer satisfaction • Deep experience in satisfaction measurement • Measures 40 industries, 6 continents • Covered sectors account for 66% of the U.S. economy • Well respected in scholarly and business literature • Quarterly findings are widely covered in the media • For more information, see www.theacsi.org
Private Sector Companies Measured • ABN AMRO (Interfirst) • AAFES (Worldwide) • Apple, Inc. • Banco Bilbao Vizcaya (Spain) • Bell South (U.S.) • Best Buy (U.S.) • Blue Cross Blue Shield Assoc. • Cable & Wireless (19 countries) • Coca-Cola (U.S.) • Comerica (U.S.) • Compuware (U.S.) • Deutsche Bank (Europe) • Earthlink (U.S.) • Electrolux (Europe) • FedEx • Ford Motor Company (U.S.) • GE Capital (U.S.) • Gateway (U.S.) • General Motors • Google • H & R Block (U.S.) • Hyatt Corporation • Magotteaux (Europe) • McDonald’s (U.S.) • MSNBC • Nordea (Sweden, Finland) • Scandinavian Airlines (Sweden, Denmark, Norway) • Sears Roebuck and Co. (U.S.) • ServiceMaster (U.S.) • Sprint Nextel • Starbucks • Telecom Italia (Italy) • Vattenfall (Sweden)
Public Sector Agencies Measured • Bureau of Labor Statistics • Centers for Medicare and Medicaid Services • Central Intelligence Agency • Corporation for National Service • Department of Commerce • Department of Education, Federal Student Aid • Department of Housing and Urban Development • Department of State • Export-Import Bank • Federal Aviation Administration • Food Safety and Inspection Service • General Services Administration • Health Resources and Services Administration • Internal Revenue Service • National Aeronautics and Space Administration • National Cancer Institute • National Institutes of Health • National Science Foundation • Pension Benefit Guarantee Corporation • Railroad Retirement Board • Small Business Administration • Social Security Administration • United States Customs Service • United States Food and Drug Administration • United States Mint • University of Michigan
Cobalt’s Nonprofit Programs Business Engagement and Priority Assessment Citizen Engagement and Priority Assessment Health and OPEB Funding Strategies: National Survey of Local Governments Retiree Engagement and Priority Assessment Rapid Policy/Marketing Survey Employee Engagement and Priority Assessment Focus Groups/Citizen Work Groups Facilitated Meetings/Audience Response Budget Priority Assessment Member Engagement and Priority Assessment School Engagement and Priority Assessment Needs and Expectations Study
How many people work for your local government (full time)? • 0-25 • 26-100 • 101-250 • 251+ :01
How many people live in your community? • Fewer than 5,000 • 5,001-10,000 • 10,001-25,000 • 25,001-100,000 • 100,000+ :07
How many different communities have you lived in? • Only 1 • 1-3 • 4-6 • 7-9 • 10 or more :10
An Ideal Community How do you know it when you see it?
No Community is Perfect “Yes, the operator should have seen the deer, and yes, it should have been removed.” PENNSYLVANIA DEPARTMENT OF TRANSPORTATION, on a road repair crew that paved over a dead deer.
In the last 3 years, which citizen engagement activities have you done? • General surveys • Special topic surveys • Focus groups • Citizen workgroups • Other types of studies • None of these :08
What is the number 1 reason that citizen engagement matters? • Perception impacts behaviors • Improves support for difficult decisions • Helps balance demands of vocal minorities • Illustrates what the community wants now and in the future • Demonstrates open government • Leading indicator of election outcomes • CYA :09
A Fundamental Question: If you are a community leader, where do individual community members want you to lead?
A Second Fundamental Question: Can you demonstrate that you deliver value based on the community’s perceptions and priorities?
Florida Local Governments Deliver Value: Ranking In Perceived Performance (#32 in 2011)
Benchmarking Defined • Benchmarking is the comparison of an organization’s performance against that of another. The resulting metrics support decisions on which changes improve outcomes. • Benefits: • Improve service (response time, accuracy, reliability) • Speed implementation • Reduce costs • Build credibility
How satisfied are you with the benchmarking you have conducted in the past 3 years? Use a 10 point scale where 1 means “Very Dissatisfied” and 10 means “Very Satisfied.” • 1 • 2 • 3 • 4 • 5 • 6 • 7 • 8 • 9 • 10 :09
What are the biggest barriers to benchmarking for your community? (mark 2) • Low buy in • Limited agreement on community priorities • Inadequate staff time • Inadequate staff skills • Quality of data • Cost of gathering data • Too many things being measured • Poor connection with strategy • Poor connection with resource decisions :09
Types of Performance Metrics • Hard “Operational” Metrics (like costs or defects) • Soft “Perception” Metrics (like satisfaction or brand identity)
Measuring from the Inside Out: Why Operational Metrics Matter • Operational metrics are useful for tracking financial data, managing processes, and offering “lead indicators” of future perceptions and other outcomes • Example: Near misses are leading indicators of accidents • Such measures support efforts to manage quality, compliance, safety and cost before problems become public problems • They help identify training, process and resource gaps • The ultimate lag indicators: elections and lawsuits
Measuring from the Inside Out: Establishing Priorities (fire department example) Response Time Performance Follow up Cost per Call
Which Area Should Be Improved? • Response time • Follow up • Cost per call • Don’t know :09
Measuring from the Outside In: Why Citizen Research Matters • Perception is a product: Satisfaction impacts behaviors you care about • Measuring perceptions useful for tracking resident expectations and opinions. They know them, so you should too • Understanding residents helps you tap residents to improve and promote your community – Brand Management • Supports balancing the demands of vocal minorities with the reality of limited resources • Bottom line outcome measurement of service and trust: Good government requires quality measurement and reporting – and builds political capital
Measuring from the Outside In: Mapping Process Impact on Outcomes Response time Performance Follow up Cost per call Impact
Characteristics of an Effective Measurement Ecosystem • Connects directly to outcomes and strategic goals • Supports focus of resources • Allows monitoring of high-risk processes • Is simple to gather and understand • Triggers action
Linking Internal and External Metrics:Balanced Scorecard/ Management Dashboard Align KEY measurable activities with strategic goals Resident Metrics(strategic outcomes) (satisfaction, “safe community,” community image, vacancy rates, administration support, etc.) External Financial Metrics (allocating resources) (cost per unit, programs on budget, cash flow, per capita tax, etc.) If/Than Internal Process Metrics(doing the right things)(communication activities, project milestones, production volume, etc.) Internal Learning and Growth Metrics (having the right skills)(% training goals achieved, % certified, staff retention, etc.)
Qualitative Methods • Council/Board Conversations • Employee/Citizen Focus Groups • Interviews
In the last 3 years, which qualitative methods have you used? (Mark all that apply) • Focus groups • Interviews • Guided conversation • None of these :09
Qualitative Benefits/Limitations • Provides insight into “why” and “how” questions • Excellent for exploration, understanding language, understanding connections • Provide powerful, personal stories about the topic under review • Provide powerful, personal stories about the topic under review • Should not be generalized • Subject to groupthink
Qualitative Uses • Understanding and improving processes (NOT measuring processes) • Explore the range of beliefs and attitudes about a topic • Brainstorm high-value features and benefits of services and programs (current and future) • Gather high-power stories to support initiatives • DO NOT GENERALIZE
Focus Group Tips • Target 8-12 participants with common characteristics (ie library users) • Recruit 15 per group, and consider an incentive • Confirm and remind them often • Conduct groups in pairs • Schedule 1-2 hours • Keep staff and officials out of the room
Quantitative Methods • Surveys • Operational Metrics • Ethnographic (direct observation and measurement)
In the last 3 years, which quantitative methods have you used? (Mark all that apply) • Surveys • Operational Metrics • Ethnographics • None of these :09
Quantitative Benefits/Limitations • Identifies who, how many, and to what extent • Can be generalized and used for benchmarking • Can do complex analysis • Can be very expensive • Does not offer good insight into “why” and “how” • Generally relies on fixed variables – may miss something important • Relies on technical expertise and prone to misinterpretation • Results can induce acute MEGO (My Eyes Glaze Over)
Sampling • Makes or breaks many quantitative measures • Drawn from population to be studied • Drawn in a truly random way, so all individuals in the population have an equal chance of participating • Is the Achilles heel of many phone and online surveys
Correct Sampling Mirrors the Population Sample Population Count of People Characteristic (ie Satisfaction) Count of People Characteristic (ie Satisfaction)
Important Measurement System Features • Comparability: Can you take your results and compare them to other communities and other organizations on an apple-to-apple basis? • Methodology: Are the sampling, collection and analysis based on accepted practice? • Repeatability: Can you afford the fees and staff time to repeat the measures? • Validity: Can you determine if changes are because of your actions or because of wider social, economic or political changes? • Credibility: Are your tools used outside your organization and outside your sector? • Payoff: Can you demonstrate both short-term and long-term wins? What is the pragmatic bottom line?
Cobalt Citizen Satisfaction Survey Nonprofit Research Program
Methodology • Can be conducted by phone, mail or online, or a combination • Typically, done by mail with online for best result • Two waves of mailings to 1,500 randomly selected citizens (usually from voter registration) • Response rate usually 25-35% (very solid) • Margin of error +/- 3% • Takes 6-8 weeks from approval of survey to report in your hands
National Baseline Methodology • Collected 2,500 responses from a random sample of adults across the United States • Conducted by mail to randomly selected citizens with option to complete online • Margin of error varies with level of analysis, and national level of analysis is +/- 1.2% and regional is approximately +/- 2.5% • Results are tied with U.S. Census Bureau codes, so results can be linked to broader governmental and academic datasets (migration, economic health, etc.)
Citizen Engagement Model Citizen Experiences Outcome Behaviors CitizenSatisfaction=Value Schools Remain Transportation Recommend CSI Fire/Emergency Volunteer Utility Encourage Businesses Police Support Admin Health Care • Overall Satisfaction • Compared to expectations • Compared to ideal Community Image Taxes Shopping Local Government Events Economy Parks/Rec Where to improve Where to invest next Library