Download
1 / 39
500 likes | 1.61k Views
Exercise 6 Dose linearity and dose proportionality. Objectives of the exercise. To learn what is dose linearity vs. dose proportionality To document dose proportionality using ANOVA To test dose linearity/proportionality by linear regression

E N D
Objectives of the exercise • To learn what is dose linearity vs. dose proportionality • To document dose proportionality using ANOVA • To test dose linearity/proportionality by linear regression • To test and estimate the degree of dose proportionality using a power model and a bioequivalence approach
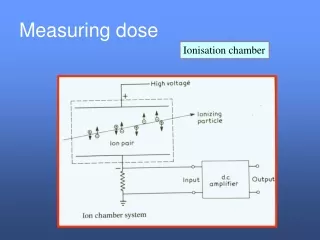
Linearity: an overview • In drug development, it is essential to determine whether the disposition a new drug are linear or nonlinear
Linearity and stationary • Basic PK parameters (F%, Cl, Vss,…) are usually independent of the dose (linearity) and repeated (continuous) administrations (stationary) • Otherwise they are • Dose dependent (non-linearity PK) • Time dependent (non-stationary PK)
Why is it important for a drug company to recognize dose dependent kinetics? • Drugs which behave non-linearly are difficult to use in clinics, specially if the therapeutic window is narrow (e.g.: phenytoin) • drug monitoring • Thus, EU guidelines required to document linearity
Why is it important for a drug company to recognize dose dependent kinetics? • Drug development is often stopped if non-linearity is observed for the usual therapeutic concentration range • Non linearity is often observed in toxicokinetics (higher doses are tested) • sophisticated data analysis • data interpretation: need to know whether non-linearity exists or not !
Linearity and order of a reaction • Order 1: linearity • In a linear system all processes (absorption, distribution, … are governed by a first order reaction • Order < 1: Michaelis-Menten • Order zero: perfusion, implant
Dose proportionality • For a linear pharmacokinetic system, measures of exposure, such as maximal concentration (Cmax) or area under the curve from 0 to infinity (AUC), are proportional to the dose. • This can be expressed mathematically as:
Assessment of dose proportionality • Analysis of variance (ANOVA) on PK response normalized (divided) by dose • Linear regression (simple linear model or model with a quadratic component) • Power model
ANOVA for dose proportionality If H0 not rejected, no evidence against DP
Linear regression • The classical approach to test DP is first to fit the PK dependent variable (AUC, Cmax…) to a quadratic polynomial of the form: Where the hypothesis is whether beta2 and alpha equal or not zero. Dose non-proportionality is declared if either parameter is significantly different from zero.
If only beta2 is not significantly different from 0, the simple linear regression is accepted. • where alpha is tested for zero equality. • If alpha equals zero, then Eq. 1 holds and dose proportionality is declared. • If alpha does not equal zero, then dose linearity (which is distinct from dose proportionality) is declared.
Limits of the classical regression analysis • The main drawback of this regression approach is the lack of a measure that can quantify DP; also when the quadratic term is significant or when the intercept is significant but close to zero, we are unable to estimate the magnitude of departure from DP. • This point is addressed with the power model
Power model and dose proportionality (DP) • An empirical relationship between AUC and dose (or C) is the following power model: In this model, the exponent (beta), i.e. the slope is a measure of DP.
Power model and dose proportionality (DP) • Taking the LN-transformation leads to a linear equation and the usual linear regression can then applied to this situation • where beta, the slope, measures the proportionality between Dose and Y. • If beta=0, it implies that the response is independent from the dose • If beta=1, DP can be declared.
Power model and DP:issue associated to the classical H0 • If an imprecise study lead to large confidence intervals around β, • Youcannot reject the classical H0 and you can conclude to a DP but that is in fact meaningless
Bioequivalence : the test problem From a regulatory point of view the producer risk of erroneously rejecting bioequivalence is of no importance The primary concern is the protection of the patient (consumer risk) against the acceptance of BE if it does not hold true
Bioequivalence : the test problem Classical test of null hypothesis (I) H 0 : T- R = or T= R H 1 : T - R or TR T and R : population mean for test and reference formulation respectively Decision on the BE cannot be based on the classical null hypothesis
Classical statistical hypothesis: drawback F% Ref Test n=1000 n=1000 100 702 652 Statistically different for p 0.05 but actually therapeutically equivalent
Classical statistical problem : the drawback F% Ref Test n=3 n=3 100 70 30 0 Not statistically different for p 0.05 but actually not therapeutically equivalent
Bioequivalence : the test problemClassical test of null hypothesis • Can be totally misleading • Acceptance of B.E. despite clinically relevant difference between R and T formulation • Rejection of B.E. despite clinically irrelevant difference between R and T
Bioequivalence : the test problemClassical test of null hypothesis Use of the classical null hypothesis would encourage poor trials, with few subjects, under uncontrolled conditions to answer an irrelevant question
Bioequivalence: the test problem • The appropriate hypothesis H01 (Ref -test) H02 (Ref -test) H0 q1 q2 inequivalent (Ref -test) H1 q2 equivalent q1 Observation
Bioequivalence: the test problem • The appropriate hypothesis q2 q1 (Ref -test) H01 H02 5% 5% two unilateral "t" tests Can we also reject H02? Can we reject H01? YES YES Bioequivalent
Two unilateral t test and a 90% • From an operational point of view to perform 2 unilateral t-tests or to compute the 90% CI (of the ratio) lead to exactly the same conclusion.
Decision procedures for the power model DP not accepted DP not accepted 1 2 the 90 % CI of the slope 80% +125% DP accepted
Power model: construction of a 90% CI • If Y(h) and Y(l) denote the value of the dependent variable, like Cmax, at the highest (h) and lowest (l) dose tested, respectively, and the drug is dose proportional then: where Ratio is a constant called the maximal dose ratio. Dose proportionality is declared if the ratio of geometric means Y(h)/Y(l) equals Ratio
Construction of a 90% CI • The a priori acceptable confidence interval (CI) for the SLOPE (see Smith et al for explanation) is given by the following relationship: Here 0.8 and 1.25 are the critical a priori values suggested by regulatory authorities for any bioequivalence problem after a data log transformation.
Fist analysis: an ANOVA to test H0 • Conclusion of the ANOVA: in the present experiment, there was no evidence against the null hypothesis of BPA dose proportionality for BPA doses ranging from 2.3 and 100000 µg/kg”
Linear regression analysis • Unweighted vs. weighted simple linear regression
Power model Observed Y and Predicted Y for the power (linear log-log ) model with data corresponding to doses ranging from 2 to 100 000µg/kg (log-log scale) ; visual inspection of figure 7 gives apparent good fitting.
Power model X vs. weighted (w=1) residual Y for a log-log linear power model with data corresponding to doses ranging from 2 to 100 000µg/kg; inspection of figure 8 indicates appropriate scatter of residuals (no bias, homoscedasticity)
The univariate CI for the SLOPE (0.9026-1.030) as computed by WinNonLin is a 95% CI computed with the critical ‘t’ value for 20 ddl i.e. t=2.086. To compute a 90% CI i.e. (1-2*alpha) 100%, the critical “t” for 20 ddl is 1.725 and the shortest 90% CI of the SLOPE is 0.9137-1.019; this is the classical shortest interval computed for a bioequivalence problem.
a priori confidence interval for BPA dose ratio • the a priori confidence interval for this BPA dose ratio was 0.9794-1.0206 it can be concluded that both the 95 and the 90% CI for the SLOPE were not totally included in this a priori regulatory CI and then the BPA dose proportionality cannot be accepted (proved) for this range of BPA doses;