Download
1 / 22
220 likes | 220 Views
This article explores the concept of multimetrics, a combination of different measures, in assessing the status of a site. It discusses how individual measures are chosen, scaled, and combined additively to indicate impairment levels. The article also discusses the use of classification and ordination methods in assessing site status.

E N D
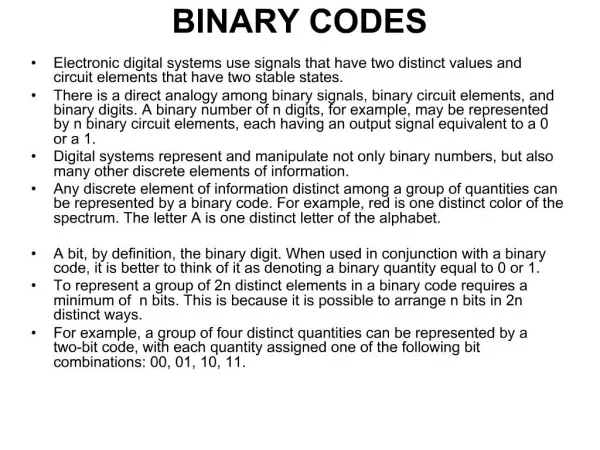
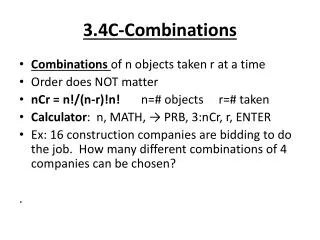
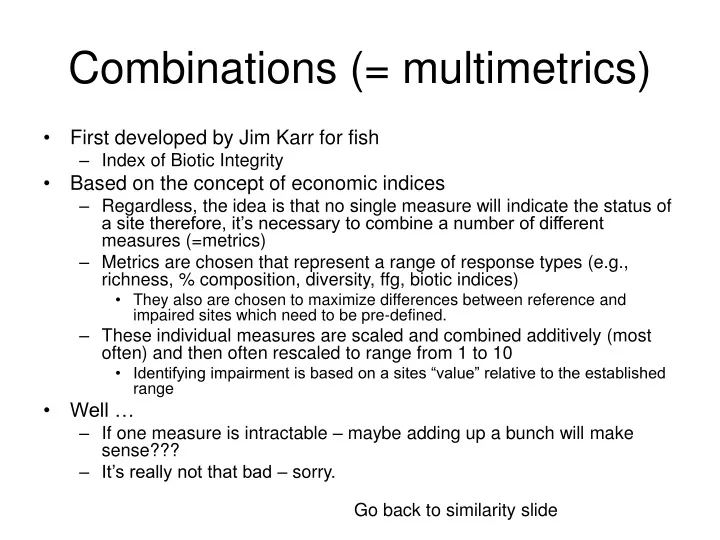
Combinations (= multimetrics) • First developed by Jim Karr for fish • Index of Biotic Integrity • Based on the concept of economic indices • Regardless, the idea is that no single measure will indicate the status of a site therefore, it’s necessary to combine a number of different measures (=metrics) • Metrics are chosen that represent a range of response types (e.g., richness, % composition, diversity, ffg, biotic indices) • They also are chosen to maximize differences between reference and impaired sites which need to be pre-defined. • These individual measures are scaled and combined additively (most often) and then often rescaled to range from 1 to 10 • Identifying impairment is based on a sites “value” relative to the established range • Well … • If one measure is intractable – maybe adding up a bunch will make sense??? • It’s really not that bad – sorry. Go back to similarity slide
Multivariate Methods Many many methods are used
Classification • Similarities measures • Many types • Think about the anticipated effect • Clustering algorithms • Many types • Most common Unweighted pair-group with arithmetic averages (UPGMA) • But … • Many types of • Similarity measures and clustering algorithms • Dichotomous • In or out of a group
Ordination • Many different types • Principal objectives • Reduce the dimensionality of species X sample and or environmental X sample data • Determine trends in space and time • Develop a species X sample correlate to real or derived environmental variables
Uses/methods of Ordination • Inference • Species distributions are used to infer environmental variables • Temperature in Montana • Indirect gradient analysis • Variation in species distributions are determined • Without a priori knowledge regarding “controlling” environmental gradients • Often then related to environmental variables • Many different methods • Direct gradient analysis • Often synonymous with constrained ordination • Searches for gradients in species data which are a “direct” function of environmental data • Sometimes “constrained” within the limits of the environmental data • Correspondence Analysis, Canonical Correlation Analysis (CCA)
Two (of the many) methods of assessment • Univariate approaches • IBI = multimetrics • Index of Biotic Integrity • RBP • Rapid Bioassessment Protocol • Multivariate • Endless methods but … • RIVPACS • River Invertebrate Prediction and Classification System • All methods “require” the collection of physical/chemical data • RBP generally metric-driven • RIVPACS species-driven
RBP • An a priori site classification is performed to establish two groups - impaired and least impaired (reference) • Physical/chemical/habitat (e.g., VHA) data are used • Species X site data are collected • Various levels of effort (fixed count size and taxonomic) are used (RBP I, II, III) • Metrics are derived • Richness, FFG, Biotic indices, … • Metrics are chosen based on their ability to differentiate impaired from reference • They could be chosen based on a hypothesized response to a known stressor – but … • Chosen metrics are added to form a multimetric and rescaled • Sites are classified into levels of impairment
RIVPACS • Inverts are collected from least impaired sites that represent the “total” range of sites to be “tested” • “Reference” sites • Physical/chemical/habitat data are collected at each site • Relatively little data are needed • Sites are classified into similar groups based on their species composition • Using a classification routine (e.g., TWINSPAN, UPGMA w/ % similarity) • The probability of a site being a member of a group is determined by Multiple Discriminant Function Analysis • MDFA differs from MLR in that dependent variables are discrete not continuous • Using p/c/h data that are not impacted by humans • The probability of occurrence at a site of each species is calculated as: • = Σ probability of a site belonging to a group X proportion of the sites within each group a species occurs sum across all groups • “Delete” rare species • Choose a probability of occurrence of a species (e.g., p>.75 or .5) • List the number of taxa predicted based on the above probability of occurrence and sum their probabilities to form the number of taxa Expected • Collect inverts using the same effort from “test” sites • Compare as Taxa observed/taxa expected (O/E)
Multimetric “Reference” sites are needed P/C/H data are needed Metrics are calculated and compared between ref and test Multimetric is “formed” Test sites are compared to reference sites RIVPACS “Reference” sites are needed P/C/H data are needed Multivariate analyses are used to determine probability of occurrence of individual taxa Species presence of test sites are compared to “reference” sites Compare and Contrast Both methods need to establish a measure of how different is different
The (End) Beginning • Read (critically) as much as possible • LEARN your stats • Question virtually everything • But also search for the answer • Think critically • Think – “if I were a bug” • Integrate all you’ve learned and ask: • Does it make sense?