Download
1 / 21
210 likes | 214 Views
Spatial analysis 101. Megan Brown Water Availability Division. Mission Goals. Mission Outline: Introduce the Spatial Analyst extension Tour of most useful tools Demo Mission Goals: Understand the basic theories behind spatial analysis Conduct basic analysis

E N D
Spatial analysis 101 Megan Brown Water Availability Division
Mission Goals • Mission Outline: • Introduce the Spatial Analyst extension • Tour of most useful tools • Demo • Mission Goals: • Understand the basic theories behind spatial analysis • Conduct basic analysis • Ability to confidently explore new tools independently
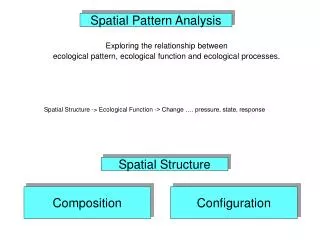
What is Spatial Analysis? • Spatial analysis encompasses all the operations performed on geographic data that add value • The single most defining characteristic of spatial analysis is its location-dependent nature • New information is generated by identifying patterns that relate data characteristics (attribute table) to the data’s spatial characteristics (geographic location)
Thinking About spatial analysis • Normative analysis – identify best solution to a spatial dependent problem Where is the best location to put the thing, based on factors X, Y and Z? • Deductive analysis – test existing theories or principals, validity of relationships Do occurrences of risk factors correlate with occurrences of an outcome? • Inductive analysis – discern patterns Is there a spatial trend or clustering to the things?
Be BraveYou are not going to break it • Do not be afraid to experiment with data and new tools!! • Remember, the original data is not altered when a tool is run. A new data output is generated. • You can always delete outputs and try something else. • Keep “test data” to experiment with • Usually means having a separate location with copies of datasets • You might create dummy test data • If your test data gets messed up you can always: • delete it • start with a fresh copy • nothing lost!
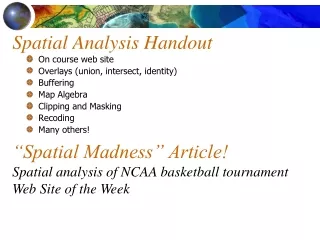
Tool Help The tool help button on any tool will take you to ESRI’s comprehensive online searchable data dictionary explaining all of the standard tools and the calculations they utilize.
Surface Tools Demo Examples: Slope Viewshed
Viewshed Note: Viewshed doesn’t necessarily make pretty outputs. In order to discern the maximum amount of information, being mindful about your layer stacking and transparency settings as well as color contrast is important. We can see here that the point selected is in a low spot, and the viewshed highlights the surrounding cliff faces as the only visible features on the slope raster.
Groundwater Tools Groundwater requires very complex data inputs. We won’t be demonstrating any examples of our own today, but below for your reference is a url to ESRI’s forum on groundwater analysis. If this applies to you, I encourage you to explore it further.
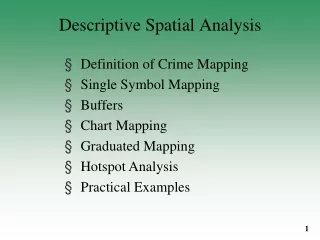
Density Tools Great tool set for finding “hotspots” or analyzing demographic data
Applied Demo: Site assessment for water testing station • Step 1-- Identify limiting factors • Slope • Proximity to stream • Floodplain • Proximity to roads for access • Within 3 miles downstream of point of interest • Step 2 – Acquire data • Acquire a local DEM • Stream, floodplain, roads layers • Coordinates of POI • Step 3 – Outline Process • Generate slope • Buffers for proximity • Convert vector to raster • Reclass • Weighted Overlay • Step 4 -- Choose Processing Method • By hand, one step at a time? • Model Builder? • Python script? • Step 5 – Spatial Analysis
Choose A Site If orange denotes areas that meet our criteria, where would you put your site(s)?
Take Away Wisdoms • Spatial analysis is a way to analyze data based on it’s spatial relationships • Spatial Analyst holds a plethora of useful tools • Tool Help is an invaluable resource • Some tool sets are designed to work together • Complex tools aren’t scary • Don’t be afraid to try new things!
Questions Contact Info: 512-239-2248 Megan.Brown@tceq.texas.gov www.LinkedIn.com/in/brownmegane