Download

1 / 20
200 likes | 208 Views
Working with Asian and Pacific Islander Data. I. Coding Issues with Major Asian Groups. Francis P. Boscoe, Ph.D New York State Cancer Registry. Specified Asian race groups in the NAACCR Data Standards: Chinese (04) Japanese (05) Filipino (06) Korean (08)

E N D
Working with Asian and Pacific Islander Data I. Coding Issues with Major Asian Groups Francis P. Boscoe, Ph.D New York State Cancer Registry
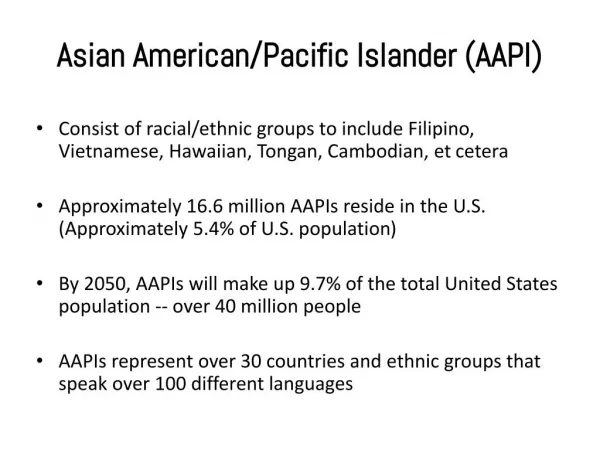
Specified Asian race groups in the NAACCR Data Standards: Chinese (04) Japanese (05) Filipino (06) Korean (08) Asian Indian/Pakistani (09) Vietnamese (10) Laotian (11) Hmong (12) Kampuchean (13) Thai (14) Asian, not otherwise specified (96)
Pie chart showing share of population of Asian groups 6 major groups = 89% Source: 2000 Census, SF2
Top 5 cancers among Asian subgroups: Males, 2000-2004 • Filipino (total cases = 11,429) • Prostate 30.3% • Lung 18.1% • Colon & Rectum 12.9% • Non-Hodgkin Lymphoma 5.2% • Liver 4.2% • Japanese (8,502) • Prostate 28.1% • Colon & Rectum 17.1% • Lung 12.4% • Stomach 6.7% • Bladder 5.7% • Chinese (14,850) • Prostate 21.2% • Lung 15.9% • Colon & Rectum 15.2% • Liver 7.7% • Stomach 5.5% Vietnamese (4,983) Lung 18.5% Prostate 15.5% Liver 15.1% Colon & Rectum 11.3% Stomach 5.7% Korean (4,471) Colon & Rectum 14.8% Stomach 14.1% Prostate 13.7% Lung 13.6% Liver 10.2% source: CINA vol. 3
Top 5 cancers among Asian subgroups: Females, 2000-2004 • Filipino (total cases = 13,391) • Breast 35.7% • Colon & Rectum 9.2% • Lung 8.6% • Corpus & Uterus, NOS 6.9% • Thyroid 6.9% • Japanese (9,839) • Breast 32.5% • Colon & Rectum 15.9% • Lung 9.8% • Corpus & Uterus, NOS 5.3% • Stomach 5.2% • Chinese (14,283) • Breast 28.5% • Colon & Rectum 14.1% • Lung 11.0% • Corpus & Uterus, NOS 4.9% • Thyroid 4.6% Vietnamese (4,469) Breast 24.0% Lung 11.6% Colon & Rectum 10.8% Thyroid 7.0% Cervix 6.0% Korean (5,276) Breast 25.8% Colon & Rectum 13.6% Stomach 9.2% Lung 8.8% Thyroid 5.2% source: CINA vol. 3
Kwong et al. 2005 – Cancer incidence and mortality rates among Chinese, Filipino, Japanese, Korean, and Vietnamese in California varied greatly. Chu and Chu 2005 - Cancer incidence and mortality among Asian Indian, Chinese, Filipino, Japanese, Koreans, Vietnamese, Hawaiian and Samoan exhibited variation and change over time. (both in Cancer 2005; 104:12 suppl.)
NAPIIA algorithm nMethod for reassigning cases with code 96 (Asian, NOS) to a more specific race group using name & birthplace nVersion 1 is complete nExpected to be part of 2008 Call for Data
Research question: Are the incidence data accurate and reliable enough to publish rates for specific Asian groups, at least on a nationwide basis? As a way of testing this question,cancer cases diagnosed in New York State between 1996 and 2004 with a single race code of Chinese, Japanese, Filipino, Korean, Asian Indian/ Pakistani, and Vietnamese (n=19,290) were assessed to see if there was supporting evidence for the race code.
Supporting evidence included first name, surname at birth, birth place, and whether the case was coded as Asian in the NYS hospital inpatient database. • Cases with no supporting evidence, or where the only supporting evidence was the hospital inpatient database, were flagged as “suspicious”. • Cases with birth places in areas of negligible Asian population (e.g., Eastern Europe, South America, Middle East) were also flagged as suspicious. • Suspicious cases were subsequently manually reviewed to see if a more appropriate race code could be chosen.
First name and surname: NAPIIA name list was used (for women, the birth name was given precedence where available). Birth place: Followed NAPIIA rules, with some additional acceptable combinations (e.g., birth place of Guyana and race of Asian Indian). Examples of ‘suspicious’ cases*: n John Chooying, birthplace New York, race=Chinese n Tae Kim, birthplace unknown, race=Chinese n Walter Parker, birthplace New Jersey, race=Asian Indian *Examples are fictional, for illustrative purposes
Asian Indian/Pakistani = 09 Unknown race = 99 Most NAACCR variables: unknown = 9 White = 01 Vietnamese = 10 A transposition error rate of 1 in 4000 would be sufficient to account for the results seen. 57% of the Chinese cases miscoded as Japanese came from a single facility.
This analysis implies that Asian rates may be 5% too high, but misclassification works both ways. • - Checked for cases coded to white, black, other, or unknown whose names and birthplaces suggest Asian race • 1,126 were found. Most commonly these were cases coded as white but with distinctively Chinese, Asian Indian, or Filipino names and born in these places. • The gross misclassification errors cancel out: overall Asian rates are accurate to within 1%
Selected cancer counts among Asian subgroups in NYS, 1996-2004 • BEFORE CLEANUP • Chinese males • Lung 917 • Colorectal 780 • Prostate 677 • Liver 532 • Stomach 412 • Asian Indian males • Prostate 541 • Colorectal 190 • Lung 184 • NHL 110 • Vietnamese females • Breast 73 • Lung 27 • Cervix 26 • Colorectal 25 • Uterus 23 • Stomach 14 AFTER CLEANUP Lung 930 Colorectal 804 Prostate 702 Liver 540 Stomach 421 Prostate 441 Lung 173 Colorectal 168 NHL 105 Breast 49 Cervix 26 Colorectal 21 Lung 15 Stomach 11 Uterus 9
Conclusions & recommendations: • Data coding problems have little impact on overall Asian cancer rates • Rates for Asian Indians and Vietnamese are artificially high (~10% and 28%, respectively) because of code confusion • For cancer sites more typically associated with whites (e.g., prostate, lung), Asian Indian and Vietnamese rates are even more in error • Rates for Chinese and Koreans are 3% low, largely driven by the Asian Indian miscodes • Rates for Japanese and Filipinos are 7%-9% low, driven by Asian Indian miscodes and other problems unrelated to the codes.
Conclusions & recommendations: • These findings are only based on NYS data, but have been corroborated anecdotally by New Jersey, Texas, Louisiana and Alaska. • Problem could be minimized through the creation of new codes: • Asian Indian (say, 15) • Vietnamese (say, 16)
Conclusions & recommendations: • -There are other two digit codes with leading zeros that are transposable with other valid codes in the NAACCR Data Standards, for example: • Follow-up source central: • 03=DMV registration, 30=Hospital inpatient/outpatient • 09=HMO file, 99=unknown source
Casefinding source – the best designed two digit code of them all: