Download
1 / 37
370 likes | 481 Views
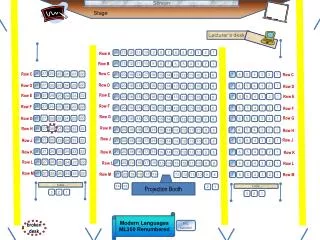
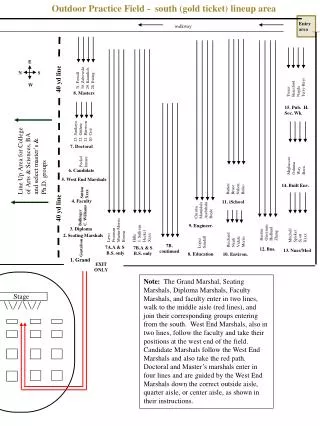
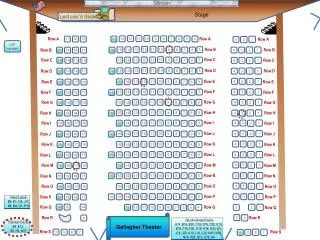
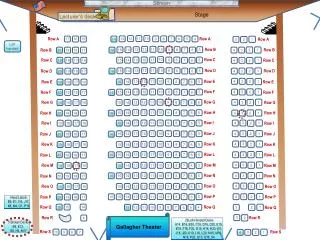
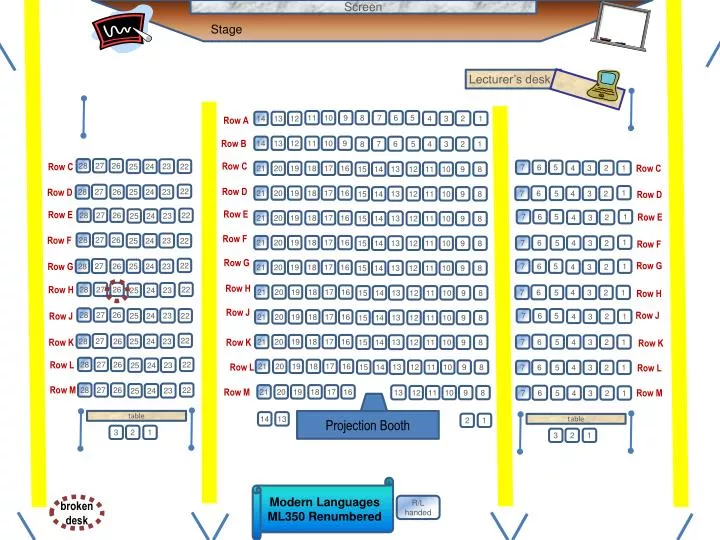
Stage. Screen. Lecturer’s desk. 11. 10. 9. 8. 7. 6. 5. 2. 14. 13. 12. 4. 3. 1. Row A. 14. 13. 12. 11. 10. 9. 6. 8. 7. 5. 4. 3. 2. 1. Row B. 28. 27. 26. 23. 25. 24. 22. Row C. 7. 6. 5. Row C. 2. 4. 3. 1. 21. 20. 19. 18. 17. 16. 13. Row C. 15.

E N D
Stage Screen Lecturer’s desk 11 10 9 8 7 6 5 2 14 13 12 4 3 1 Row A 14 13 12 11 10 9 6 8 7 5 4 3 2 1 Row B 28 27 26 23 25 24 22 Row C 7 6 5 Row C 2 4 3 1 21 20 19 18 17 16 13 Row C 15 14 12 11 10 9 8 22 27 28 26 25 24 23 Row D 1 Row D 6 21 20 19 18 17 16 13 7 5 4 3 2 15 14 12 11 10 9 8 Row D Row E 28 27 26 22 Row E 23 25 24 7 6 5 1 2 4 3 Row E 21 20 19 18 17 16 13 15 14 12 11 10 9 8 Row F 28 27 26 23 25 24 22 Row F 1 6 21 20 19 18 17 16 13 7 5 4 3 2 15 14 12 11 10 9 8 Row F Row G 22 27 28 26 25 24 23 7 6 5 1 Row G 2 4 3 Row G 21 20 19 18 17 16 13 15 14 12 11 10 9 8 Row H 28 27 26 22 23 25 24 Row H 6 21 20 19 18 17 16 13 7 5 4 3 2 1 15 14 12 11 10 9 8 Row H Row J 28 27 26 23 25 24 22 7 6 5 Row J 2 4 3 1 Row J 21 20 19 18 17 16 13 15 14 12 11 10 9 8 22 27 28 26 25 24 23 6 21 20 19 18 17 16 13 7 5 4 3 2 1 15 14 12 11 10 9 8 Row K Row K Row K 28 27 26 22 23 Row L 25 24 21 20 19 18 17 16 13 6 15 14 12 11 10 9 8 Row L 7 5 4 3 2 1 Row L 28 27 26 22 23 Row M 25 24 21 20 19 18 17 16 13 6 12 11 10 9 8 Row M 7 5 4 3 2 1 Row M table • Projection Booth 14 13 2 1 table 3 2 1 3 2 1 Modern Languages ML350 Renumbered R/L handed broken desk
Homework Worksheet: Problem 1 1 sd 1 sd .68 30 32 28
Homework Worksheet: Problem 2 2 sd 2 sd .95 32 28 34 26 30
Homework Worksheet: Problem 3 3 sd 3 sd .997 24 36 32 28 34 26 30
Homework Worksheet: Problem 4 .50 24 36 32 28 34 26 30
Homework Worksheet: Problem 5 Go to table 33-30 z = 1.5 z = .4332 2 .4332 24 36 32 28 34 26 30
Homework Worksheet: Problem 6 Go to table 33-30 z = 1.5 z = .4332 2 .9332 .4332 .5000 24 36 32 28 34 26 30
77th percentile Go to table nearest z = .74 .2700 x = mean + z σ = 30 + (.74)(2) = 31.48 .7700 .27 .5000 24 36 ? 28 34 26 30 31.48
13th percentile Go to table nearest z = 1.13 .3700 x = mean + z σ = 30 + (-1.13)(2) = 27.74 .37 .50 .13 ? 24 36 32 27.74 34 26 30
Please use the following distribution with a mean of 200 and a standard deviation of 40. Find the area under the curve between scores of 200 and 230. Start by filling in the desired information on curve 20 (to the right)(Note this one will require you to calculate a z-score for a raw score of 230 and use the z-table) Go to table 230-200 z = .75 z = .2734 40 .2734 80 320 240 160 280 120 200
Normal Distribution has a mean of 50 and standard deviation of 4. Determine value below which 95% of observations will occur.Note: sounds like a percentile rank problem 1.64 okay too Go to table .4500 nearest z = 1.65 x = mean + z σ = 50 + (1.65)(4) = 56.60 .9500 .4500 .5000 38 62 54 46 58 ? 42 50 56.60
Normal Distribution has a mean of $2,100 and s.d. of $250. What is the operating cost for the lowest 3% of airplanes.Note: sounds like a percentile rank problem = find score for 3rd percentile Go to table .4700 nearest z = - 1.88 x = mean + z σ = 2100 + (-1.88)(250) = 1,630 .0300 .4700 ? 2100 1,630
Normal Distribution has a mean of 195 and standard deviation of 8.5. Determine value for top 1% of hours listened. Go to table .4900 nearest z = 2.33 x = mean + z σ = 195 + (2.33)(8.5) = 214.805 .4900 .0100 .5000 195 ? 214.8
Try this one: Please find the (2) raw scores that border exactly the middle 95% of the curve Mean of 30 and standard deviation of 2 Go to table .4750 nearest z = 1.96 mean + z σ = 30 + (1.96)(2) = 33.92 Go to table .4750 nearest z = -1.96 mean + z σ = 30 + (-1.96)(2) = 26.08 .9500 .475 .475 26.08 33.92 ? ? 24 32 36 28 30
Please click in My last name starts with a letter somewhere between A. A – D B. E – L C. M – R D. S – Z
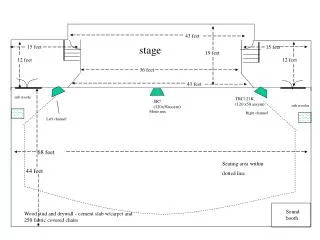
MGMT 276: Statistical Inference in ManagementRoom 350 Modern LanguagesSpring, 2012 Welcome
Please read: Chapters 5 - 11 in Lind book & Chapters 10, 11, 12 & 14 in Plous book: Lind Chapter 5: Survey of Probability Concepts Chapter 6: Discrete Probability Distributions Chapter 7: Continuous Probability Distributions Chapter 8: Sampling Methods and CLT Chapter 9: Estimation and Confidence Interval Chapter 10: One sample Tests of Hypothesis Chapter 11: Two sample Tests of Hypothesis Plous Chapter 10: The Representativeness Heuristic Chapter 11: The Availability Heuristic Chapter 12: Probability and Risk Chapter 14: The Perception of Randomness We’ll be jumping around some…we will start with chapter 7
Use this as your study guide By the end of lecture today2/16/12 Connecting raw scores, z scores and probabilityConnecting probability, proportion and area of curve Percentiles Probability of an eventComplement of the probability of an event Mutually exclusive characteristics Collectively Exhaustive Events Union and Intersection of two events Special Law of Addition Conditional Probabilities Law of large numbers Central Limit Theorem Three propositions 1) True mean 2) Standard Error of Mean 3) Normal Shape
Homework due - (February 21st) On class website: please print and complete homework worksheet #7 Please double check – Allcell phones other electronic devices are turned off and stowed away
If P(A) = 0, then the event cannot occur. If P(A) = 1, then the event is certain to occur. The probability of an event is the relative likelihood that the event will occur. The probability of event A [denoted P(A)], must lie within the interval from 0 to 1: 0 <P(A) < 1
Probability The probabilities of all simple events must sum to 1 P(S) = P(E1) + P(E2) + … + P(En) = 1 For example, if the following number of purchases were made by
What is the complement of the probability of an event • The probability of event A = P(A). • The probability of the complement of the event A’ = P(A’) • A’ is called “A prime” • Complement of A just means probability of “not A” • P(A) + P(A’) = 100% • P(A) = 100% - P(A’) • P(A’) = 100% - P(A) Probability of getting a rotten apple 5% chance of “rotten apple” 95% chance of “not rotten apple” 100% chance of rotten or not Probability of getting into an educational program 66% chance of “admitted” 34% chance of “not admitted” 100% chance of admitted or not
Two mutually exclusive characteristics: if the occurrence of any one of them automatically implies the non-occurrence of the remaining characteristic Two events are mutually exclusive if they cannot occur at the same time (i.e. they have no outcomes in common). Two propositions that logically cannot both be true. NoWarranty Warranty For example, a car repair is either covered by the warranty (A) or not (B). http://www.thedailyshow.com/video/index.jhtml?videoId=188474&title=an-arab-family-man
Collectively Exhaustive Events Events are collectively exhaustive if their union isthe entire sample space S. Two mutually exclusive, collectively exhaustive events are dichotomous (or binary) events. For example, a car repair is either covered by the warranty (A) or not (B). NoWarranty Warranty
NoWarranty Satirical take on being “mutually exclusive” Warranty Recently a public figure in the heat of the moment inadvertently made a statement that reflected extreme stereotyping that many would find highly offensive. It is within this context that comical satirists have used the concept of being “mutually exclusive” to have fun with the statement. Decent , family man Arab Transcript: Speaker 1: “He’s an Arab” Speaker 2: “No ma’am, no ma’am. He’s a decent, family man, citizen…” http://www.thedailyshow.com/video/index.jhtml?videoId=188474&title=an-arab-family-man
Union versus Intersection ∩ P(A B) Union of two events means Event A or Event B will happen Intersection of two events means Event A and Event B will happen Also called a “joint probability” P(A ∩ B)
The union of two events: all outcomes in the sample space S that are contained either in event Aor in event Bor both (denoted A B or “A or B”). may be read as “or” since one or the other or both events may occur.
The union of two events: all outcomes contained either in event Aor in event Bor both (denoted A B or “A or B”). What is probability of drawing a red card or a queen? what is Q R? It is the possibility of drawing either a queen (4 ways) or a red card (26 ways) or both (2 ways).
Probability of picking a Queen Probability of picking a Red 26/52 4/52 P(Q) = 4/52(4 queens in a deck) 2/52 P(R) = 26/52 (26 red cards in a deck) P(Q R) = 2/52 (2 red queens in a deck) Probability of picking both R and Q When you add the P(A) and P(B) together, you count the P(A and B) twice. So, you have to subtract P(A B) to avoid over-stating the probability. P(Q R) = P(Q) + P(R) – P(Q R) = 4/52 + 26/52 – 2/52 = 28/52 = .5385 or 53.85%
Union versus Intersection ∩ P(A B) Union of two events means Event A or Event B will happen Intersection of two events means Event A and Event B will happen Also called a “joint probability” P(A ∩ B)
The intersection of two events: all outcomes contained in both event A and event B(denoted A B or “A and B”) What is probability of drawing red queen? what is Q R? It is the possibility of drawing both a queen and a red card (2 ways).
If two events are mutually exclusive (or disjoint) their intersection is a null set (and we can use the “Special Law of Addition”) P(A ∩ B) = 0 Intersection of two events means Event A and Event B will happen Examples: mutually exclusive If A = Poodles If B = Labradors Poodles and Labs:Mutually Exclusive (assuming purebred)
If two events are mutually exclusive (or disjoint) their intersection is a null set (and we can use the “Special Law of Addition”) P(A ∩ B) = 0 ∩ Dog Pound P(A B) = P(A) +P(B) Intersection of two events means Event A and Event B will happen Examples: If A = Poodles If B = Labradors (let’s say 10% of dogs are poodles) (let’s say 15% of dogs are labs) What’s the probability of picking a poodle or a lab at random from pound? P(poodle or lab) = P(poodle) + P(lab) P(poodle or lab) = (.10) + (.15) = (.25) Poodles and Labs:Mutually Exclusive (assuming purebred)
Conditional Probabilities Probability that A has occurred given that B has occurred Denoted P(A | B): The vertical line “ | ” is read as “given.” P(A ∩ B) P(A | B) = P(B) The sample space is restricted to B, an event that has occurred. A B is the part of B that is also in A. The ratio of the relative size of A B to B is P(A | B).
Conditional Probabilities Probability that A has occurred given that B has occurred Of the population aged 16 – 21 and not in college: P(U) = .1350 P(ND) = .2905 P(UND) = .0532 What is the conditional probability that a member of this population is unemployed, given that the person has no diploma? .0532 P(A ∩ B) .1831 = P(A | B) = = .2905 P(B) or 18.31%
Conditional Probabilities Probability that A has occurred given that B has occurred Of the population aged 16 – 21 and not in college: P(U) = .1350 P(ND) = .2905 P(UND) = .0532 What is the conditional probability that a member of this population is unemployed, given that the person has no diploma? .0532 P(A ∩ B) .1831 = P(A | B) = = .2905 P(B) or 18.31%
Thank you! See you next time!!