Download
1 / 8
80 likes | 85 Views
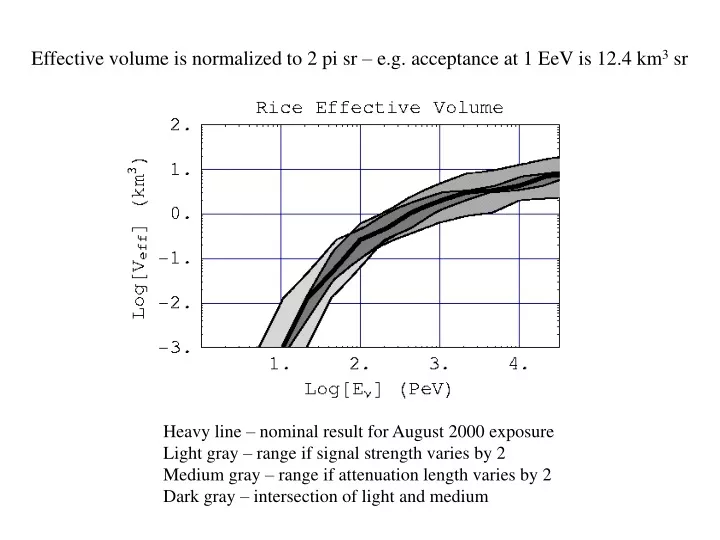
Effective volume is normalized to 2 pi sr – e.g. acceptance at 1 EeV is 12.4 km 3 sr. Heavy line – nominal result for August 2000 exposure Light gray – range if signal strength varies by 2 Medium gray – range if attenuation length varies by 2 Dark gray – intersection of light and medium.

E N D
Effective volume is normalized to 2 pi sr – e.g. acceptance at 1 EeV is 12.4 km3 sr Heavy line – nominal result for August 2000 exposure Light gray – range if signal strength varies by 2 Medium gray – range if attenuation length varies by 2 Dark gray – intersection of light and medium
Separation of neutrino events from thermal background Enu = 3 EeV Red – Monte Carlo exposure Black – RICE hits Blue – Reconstructed positions for “thermal triggers” m m
RICE Monte Carlo Exposure at 1 EeV For downward flux, no events below the detector Attenuation increases with warmer temperatures near the bedrock
RICE concept Neutrino enters ice Neutrino interacts RICE antenna & cable Two cones show 3 dB signal strength Cube is .6 km on side
Limits on power law fluxes F ~ En-g Color g black 1.5 red 2.0 blue 2.5 green 3.0 orange 3.5 Limits derived from absence of events consistent with neutrino induced radio pulses during Aug. 2000. Line segments denote energy interval responsible for middle 80% of events.
Limits on power law fluxes F ~ En-g Color g black 1.5 red 2.0 blue 2.5 green 3.0 orange 3.5 Note: This version of the power law flux limits plot follows George’s presentation. It is E dN/dE as opposed to E2 dN/dE, and is per yr instead of per second. The other version is more industry standard.
Limits on model fluxes Color model black GZK red AGN-1 blue AGN-2 green AGN-3 orange Topological Limits derived from absence of events consistent with neutrino induced radio pulses during Aug. 2000. Line segments denote energy interval responsible for middle 80% of events.
Limits on power law fluxes Color model black GZK red AGN-1 blue AGN-2 green AGN-3 orange Topological Note: This version of the model flux limits plot follows George’s presentation. It is E dN/dE as opposed to E2 dN/dE, and is per yr instead of per second. The other version is more industry standard.