Download

1 / 8
90 likes | 216 Views
Krew Data Presentation. Spencer Marsh Forest Lillund Christian Fernandez Michael Ritenour. Experiment Description. Our experiment is designed to tell us the altitude of our balloon using 3 different methods of altimetry. Picture pixel ratios Trigonometric triangle using Tangent

E N D
Krew Data Presentation Spencer Marsh Forest Lillund Christian Fernandez Michael Ritenour
Experiment Description • Our experiment is designed to tell us the altitude of our balloon using 3 different methods of altimetry. • Picture pixel ratios • Trigonometric triangle using Tangent • Barometric pressure
Expectations • Hypothesis A: As the height is doubled, the amount of pixels the object takes will half. • Hypothesis B: Can determine altitude with horizontal known distance and tangent angle of elevation • Hypothesis C: The barometric pressure will lessen as height is increased.
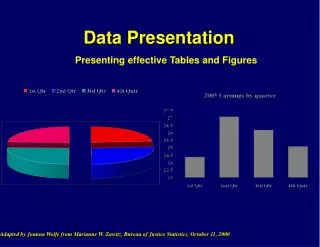
Camera Data This is where we measured the pixels of the pink ribbon.
Conclusions • Comparing the three methods, up to 500 ft of line, the calculated heights were similar. (within 5 ft) • After 500 ft, the results started to differentiate, due to visibility decreasing and unknown variables affecting the barometer.