Download
1 / 38
380 likes | 492 Views
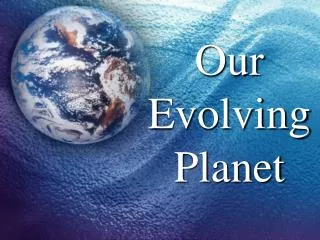
Our Planet Was Once Much Warmer. Seventy-five million years ago, the Earth's average temperature was about 10°F (5.6°C) higher than it is today. Almost everywhere the climate was warm and humid. Ancient Geography.

E N D
Our Planet Was Once Much Warmer Seventy-five million years ago, the Earth's average temperature was about 10°F (5.6°C) higher than it is today. Almost everywhere the climate was warm and humid.
AncientGeography Seventy-five million years ago, the continents had not drifted to their present positions and shallow inland seas covered much of the land.
What Made It Warmer? The atmosphere contained more carbon dioxide, a gas that traps • There were many more volcanoes than now exist and great amounts of lava to spew carbon dioxide into the atmosphere. • Much more land lay underwater. This decreased the rate by which some natural systems removed carbon dioxide from the atmosphere. The Earth absorbed more of the sun's warming rays. • Different patterns of ocean currents distributed heat around the globe more evenly than today. • There was little snow and ice cover to reflect the sunlight. The ice-free polar regions soaked up more of the sun's energy.
NYC today. Earth is 9° warmer. NYC area 20,000 years ago. The Last Ice Advance: 20,000 Years Ago At the peak of the last ice advance 20,000 years ago, the global average temperature was about 5°C lower than it is today. Large areas of the northern continents were buried under colossal sheets of ice.
What Made It Colder? Levels of carbon dioxide, a heat-trapping gas, decreased in the atmosphere. • As volcanoes and lava flows decreased, less carbon dioxide was spewed into the atmosphere. • Inland seas disappeared, more mountains formed and new plant life appeared. These changes increased the rate by which some natural systems removed carbon dioxide from the atmosphere. Earth absorbed less sunlight. • Continents slowly drifted toward the North Pole, causing the land to retain less heat. • As the planet cooled, snow and ice built up, reflecting more sunlight back into space and further increasing the global chill.
Climate Clues: Different Proxies Ice Cores drilled from glaciers hold samples of Earth's ancient atmosphere.Tree Rings reflect climate conditions year by year.Stalagmites that grow on cave floors preserve a pattern of past temperatures.Sediments that fall on the sea floor serve as archives of past ocean temperatures and currents. Lake-bottom sediments reveal lake temperatures of the past.
In Greenland a team of scientists brings up ice cores--long cylinders of ice--from thousands of feet below the glacier's surface. Ice Cores: Drilling for Climate Records One way scientists reconstruct past climate changes is by studying ice cores extracted from ancient glaciers in Antarctica and Greenland. By analyzing the ice and the air trapped within the ice cores, they can build a record of levels of two gases that trap heat in the atmosphere: carbon dioxide and methane. They can also estimate past temperature changes that go back thousands of years.
Increased Levels of Greenhouse Gas In just this past century, these gases increased to their highest level in 220,000 years. This increase resulted from industrial activity, deforestation, and agriculture.
Ice Reveals Thousands of Years of Climate Change Scientists measure levels of carbon dioxide and methane within bubbles to estimate the magnitude of the greenhouse effect in the past. They determine the air temperature at the time the snow fell by measuring the level of oxygen isotopes in ice crystals.
Tree-Ring Growth Reflects Temperature Changes A growing tree adds a new ring of wood to its trunk every year. Counting the growth rings tells the tree's age.The width of the rings provides evidence of past climate. In years when growing conditions are favorable, trees grow wider rings than in less favorable years. Using computers, scientists measure changes in ring width not obvious to the naked eye.
Temperature Graph for Tasmania, Australia: 900 to 1989 This temperature graph was made by analyzing the rings in many Tasmanian huon pines that grew between the years 900 and 1989. It shows a rise in the region's temperature since 1965.
A Closer Look at Stalagmites Like tree rings, the bands in a stalagmite represent periods of growth. To date a section of a stalagmite, scientists compare the relative amounts of certain uranium and thorium atoms. The older the section, the greater proportion of thorium it will contain, because the uranium atoms decay into thorium.After determining when the stalagmite grew, scientists can study it further to get an idea of what past climate was like.
Sediments From The Deep The remains of plants and animals, and particles such as dust and clay, accumulate through the years at the bottom of oceans and lakes and gradually build up.Scientists extract cylinders, or cores, of these sediments and analyze the contents for clues about the climate at the time they were deposited.
Decoding Sediment Cores Deep Ocean CoresSand: Lots of coastal sand in a layer of sediment far from shore means that the surface of the sea must have been very cold when the sediment was deposited. Only icebergs and sea ice carry this type of sand to the middle of the ocean.
Decoding Sediment Cores Deep Ocean Cores Tiny Marine Animals: Tiny creatures called forams (foraminifera) provide evidence of past ocean temperature. When forams die, their shells drift to the ocean floor and are preserved in the sediment. Because different types thrive in different water temperatures, when scientists find foram deposits they can estimate the temperature when the animals lived.
Decoding Sediment Cores Deep Ocean Cores Forams take up two kinds, or isotopes, of oxygen to build their shells (16O and 18O). When the water is warm, they use more of one type than the other. Measuring the relative levels of these oxygen isotopes in the shells provides another way of estimating past water temperatures.
Sediments From The Deep Cores From Lake BottomsPlant Remains: Different plants thrive at different levels of temperature and precipitation. By identifying leaves, seeds, bits of wood and pollen in lake cores, scientists can estimate climate conditions at the time when those kinds of plants were growing.
Sediments From The Deep Cores From Lake Bottoms Silt and Clay: Sediments made up largely of silt and clay indicate a cold climate. During cold periods, the plant cover is sparse, resulting in more soil erosion. The soil runoff finally ends up in the lake bottom. Sediments containing more organic matter, like pollen, were deposited when climate was warm and humid and the vegetation was denser.
The effects of global warming can disrupt human society. Historical Climate Changes: The Past 10,000 Years Even though global average temperature has remained relatively stable in the last 10,000 years, there were regional climate variations severe enough to disrupt human societies.
The Moist Sahara Region Became Desert A great variety of animals once flourished in the well-watered Sahara region of North Africa, including the water-loving hippopotamus, which no longer exists in the region. About 4000 years ago the area slowly began to dry, finally becoming a desert.
The white lines in the upper - right corner shows the old path of the Nile. The Moist Sahara Region Became Desert A satellite image reveals channels of ancient rivers that used to flow across what is now the Sahara Desert--another clue to a different climate in this region.
The Little Ice Age The period that extends roughly from 1550 to 1850 has been called the Little Ice Age. During the Little Ice Age, the Thames River in London began to freeze each winter, leading to the first "Frost Fair" in 1607. A small tent city sprang up on the river, offering amusements that included ice bowling. Since 1814, gradually rising temperatures have kept the river from freezing completely.
A Warming Century: The Past 100 Years The curved line shows the overall trend. The global average temperature has risen nearly 0.5°C since 1880.
Taking The Planet's Temperature Geological records show that Earth's temperature has been relatively stable for the past 10,000 years. If global temperature continues to rise as predicted, future warming could happen faster than any climate change of this time period.
Figure 2.22: Variations of temperature, methane, and atmospheric carbon dioxide concentrations derived from air trapped within ice cores from Antarctica (adapted from Sowers and Bender, 1995; Blunier et al., 1997; Fischer et al., 1999; Petit et al., 1999).
Figure 2.23: Time-series illustrating temperature variability over the last about 400 ky (updated from Rostek et al., 1993; Schneider et al., 1996; MacManus et al., 1999; Reille et al., 2000). The uppermost time-series describes the percentage of tree pollen that excludes pollen from pine tree species. The higher this percentage, the warmer was the climate.
Current evidence indicates that very rapid and large temperature changes, generally associated with changes in oceanic and atmospheric circulation, occurred during the last glacial period and during the last deglaciation, particularly in higher latitudes of the Northern Hemisphere. During the warming phases, and the Younger Dryas pause, there is evidence of almost worldwide, nearly synchronous events. However, as with the Holocene maximum warming and the Last Glacial Maximum, these changes appear to have occurred asynchronously between the Northern Hemisphere and at least part of the Southern Hemisphere. During the Holocene smaller but locally quite large climate changes occurred sporadically; similar changes may have occurred in the last inter-glacial. Evidence is increasing, therefore, that a rapid reorganisation of atmospheric and ocean circulation (time-scales of several decades or more) can occur during inter-glacial periods without human interference.
Figure 2.28: Reconstructions since 1700 of proxy-based ENSO indices. Shown are the Northern Hemisphere cold-season (Oct-Mar) mean NINO 3 index of Mann et al. (2000a) and the Northern Hemisphere winter SOI index of Stahle et al. (1998). The SOI series is scaled to have the same standard deviation as the NINO 3 index, and is reversed in sign to be positively correlated with the NINO 3 series. An instrumental NINO 3 index from 1871 to 2000 is shown for comparison (Rayner et al., 2000), with two standard error limits (grey shaded) of the proxy NINO 3 reconstruction.
Figure 2.29: El Niño-La Niña variations from 1876 to 2000 measured by sea surface temperature in the region 5°N to 5°S, 150 to 90°W. Reconstructions using pattern analysis methods from (a) red: UK Met Office (UKMO) Hadley Centre sea ice and sea surface temperature data set version 1 (Rayner et al., 2000); (b) black: from the Lamont-Doherty Earth Observatory (LDEO) (Kaplan et al., 1998); (c) blue: the National Centers for Environmental Prediction (NCEP) analysis (Smith et al., 1998). 1876 is close to the earliest date for which reasonably reliable reconstructions can be made.
Temperature over the global land and oceans, with two estimates for the latter, are measured and adjusted independently, yet all three show quite consistent increasing trends (0.52 to 0.61°C/century) over the 20th century. • 2. The nearly worldwide decrease in mountain glacier extent and mass is consistent with 20th century global temperature increases. A few recent exceptions in maritime areas have been affected by atmospheric circulation variations and related precipitation increases. • 3. Though less certain, substantial proxy evidence points to the exceptional warmth of the late 20th century relative to the last 1,000 years. The 1990s are likely to have been the warmest decade of the past 1,000 years over the Northern Hemisphere as a whole. • 4. Satellite and balloon measurements agree that lower-tropo-spheric temperatures have increased only slightly since 1979, though there has been a faster rate of global surface temp-erature increase. Balloon measurements indicate a larger lower-tropospheric temperature increase since 1958, similar to that shown by global surface temperature measurements over the same period. Balloon and satellite measurements agree that lower-stratospheric temperatures have declined significantly since 1979.
5. The decrease in the continental diurnal temperature range since around 1950 coincides with increases in cloud amount and, at least since the mid-1970s in the Northern Hemisphere, increases in water vapour. 6. Decreases in spring snow cover extent since the 1960s, and in the duration of lake and river ice over at least the last century, relate well to increases in Northern Hemispheric surface air temperatures. 7. The systematic decrease in spring and summer Arctic sea-ice extent in recent decades is broadly consistent with increases of temperature over most of the adjacent land and ocean. The large reduction in the thickness of summer and early autumn Arctic sea ice over the last thirty to forty years is consistent with this decrease in spatial extent, but we are unsure to what extent poor temporal sampling and multi-decadal variability are affecting the conclusions. 8. The increases in lower-tropospheric water vapour and temperature since the mid-1970s are qualitatively consistent with an enhanced hydrological cycle. This is in turn consistent with a greater fraction of precipitation being delivered from extreme and heavy precipitation events, primarily in areas with increasing precipitation, e.g., mid- and high latitudes of the Northern Hemisphere. Where data are available, changes in precipitation generally correspond with consistent changes in streamflow and soil moisture.
Figure 2.32: Schematic showing the effect on extreme temperatures when (a) the mean temperature increases, (b) the variance increases, and (c) when both the mean and variance increase for a normal distribution of temperature.