Download
1 / 79
790 likes | 1.03k Views
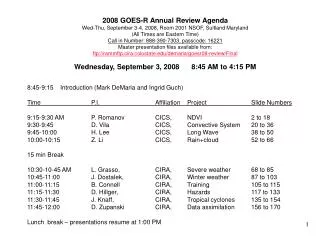
Maryland Workers Compensation Costs: A Statistical Review September 20, 2004. Presented by: Robert_Moss@ncci.com 201-386-2614. Maryland Workers Compensation Costs: Agenda. About NCCI State of the Industry Maryland Workers Compensation System Overview

E N D
MarylandWorkers Compensation Costs:A Statistical ReviewSeptember 20, 2004 Presented by: Robert_Moss@ncci.com 201-386-2614 1
Maryland Workers Compensation Costs: Agenda • About NCCI • State of the Industry • Maryland Workers Compensation System Overview • A Closer Look at Claim Frequency in Maryland • A Closer Look at Claim Severity in Maryland • Impact of “Harris vs. Bd of Ed of Howard County” case • NCCI Research 2
NCCI: Who We Are • National Council on Compensation Insurance (NCCI) manages the nation’s largest database of workers compensation insurance information. • NCCI – • analyzes industry trends. • prepares workers compensation insurance loss cost/rate recommendations. • assists in pricing proposed legislation. • provides a variety of data products to maintain a healthy workers compensation system and reduce the frequency of employee injuries. 4
NCCI’s Mission • To foster a healthy workers compensation system by providing high quality information and analytical services that result in: • Adequate loss costs/rates • Objective reform evaluation • Self-funded residual markets • Tangible value for stakeholders 5
State of the Industry—An Overview Positives: • Results are improving • Frequency continues to decline Negatives: • Medical severity continues rapid growth 8
Workers Compensation Premium Volume:A Continued Period of GrowthWorkers Compensation Net Written Premium—Private Carriers $ Billions $ Trillions $ Billions $ Trillions p PreliminarySource: 1990–2002, A.M. Best Aggregates & Averages; 2003p, NCCI and Economy.com 9
Adjusted Workers CompensationPremium VolumeWorkers Compensation Direct Written Premium—Private Carriers $ Billions $ Trillions 1. Direct of Reinsurance 2. Grossed-Up for Large Deductible Credits 3. Adjusted to 1990 Rate/Loss Cost Level 4. Grossed-Up for Carrier Departure p Preliminary.Source: NCCI. 10
Workers Compensation Net Written Premium Private Carriers and State Funds Private Carriers ($B) State Funds ($B) p PreliminarySource: 1996–2002 Private Carriers, A.M. Best Aggregates & Averages; 2003p, NCCI 1996–2003p State Funds—AZ, CA, CO, HI, ID, KY, LA, ME, MN, MO, MT, NM, OK, OR, RI, TX, UT Annual Statements 11
Accident Year 2003 Combined RatioContinues to Improve Workers Compensation Calendar Year and Ultimate Accident YearPrivate Carriers p Preliminary. Accident Year data is evaluated as of 12/31/03 and developed to ultimate. Source: Calendar Years 1994-2002, A.M. Best Aggregates & Averages; Calendar Year 2003p and Accident Years 1994-2003p, NCCI. Includes dividends to policyholders. 12
Workers Compensation Net Combined Ratios Calendar Year—Private Carriers and State Funds Percent p PreliminarySource: 1996–2002 Private Carriers, A.M. Best Aggregates & Averages; 2003p, NCCI 1996–2003p State Funds—AZ, CA, CO, HI, ID, KY, LA, ME, MN, MO, MT, NM, OK, OR, RI, TX, UT Annual Statements 13
Results Vary From State to StateAccident Year 2002 Combined Ratios Data is evaluated as of 12/31/02. 14
Cumulative 2000-2003 +17.1% Cumulative 1994-1999 -27.8% Cumulative 1990-1993 +36.3% The Average Approved Bureau Rate/Loss CostsHistory of Average Bureau Rate/Loss Cost Level Changes Percent Calendar Year p Preliminary (states approved to date in 2004). Countrywide approved changes in advisory rates, loss costs and assigned risk rates as filed by the applicable rating organization. The countrywide change is a weighted average of individual state changes based on state premium volumes and ignoring effective dates. 15
2003/2004 Filing CycleNCCI Voluntary Market Filing Activity • Data for 36 states has been reviewed • 21 states have filed increases • 13 states have filed decreases • 2 states will not have a filing • Range of voluntary filings: -12.3% to +21.2% Based on data evaluated as of 12/31/02. 17
State Voluntary Market Indications District of Columbia * 11/1/04 -1.8% Maryland * 1/1/05 +3.4% Pennsylvania 4/1/04 +3.3% Delaware 12/1/03 -6.7% Virginia * 4/1/05 +4.9% 18
The Impact on Premium of Rate/Loss Cost Departures, Schedule Rating and DividendsNCCI States—Private Carriers p Preliminary. Dividend ratios are based on calendar year statistics. Based on data through 12/31/03 for the states for which NCCI provides ratemaking services. 19
Workers Compensation ClaimFrequency and Severity • For each of the last 5 years (and 10 of the last 12), on-the-job claim frequency for workers compensation injuries has declined from the previous year’s level • Medical and indemnity costs continue to rise—somewhat negating the good news regarding reduced claims 20
While Claim Costs Rise Steadily,Frequency Continues a Slight Decline 2003p: Preliminary based on data valued as of 12/31/03. 1991–2002: Based on data through 12/31/2002, developed to ultimate. Based on the states where NCCI provides ratemaking services. Excludes the effects of deductible policies. 21
The Frequency of Lost-Time Claims Has Continued to Fall Through 2003 Percent Change Cumulative Change of –39.7% (1991–2002) 2003p: Preliminary based on data valued as of 12/31/03. 1991–2002: Based on data through 12/31/2002, developed to ultimate. Based on the states where NCCI provides ratemaking services. Excludes the effects of deductible policies. 22
Claim Frequency DeclinesHave Been Widespread • Every major industry had declines of at least 30% • Every major occupation group had declines of at least 30% • Every major age group had large declines, generally greater than 20% • Both male and female workers exhibited declines in excess of 30% 23
Workers Compensation Frequency of Lost-Time Claims by Inflation Adjusted Loss RangesPercentage Change Between Policies Expiring in 1997 and 2002Claim Frequency Per $1M of Wage Adjusted Payroll Source: NCCI WCSP data, NCCI states only Losses have been adjusted for indemnity and medical inflation based on CPS wages and Medical CPI, respectively 24
Claim Frequencies by Injury Type Percentage Change Between Policies Expiring in 1997 and 2002Claim Frequency per $1M of Wage Adjusted Payroll Source: NCCI WCSP data 25
Workers Compensation Frequency for Selected Classes Frequency = Lost-time claims/payroll; payroll adjusted for inflation. Based on NCCI WCSP data. 26
What’s Driving the Claims Frequency Trend? • Continued emphasis on workplace safety • Increased use of robotics • Modular design and construction techniques • Power-assisted processes and cordless tools • Advances in ergonomic design • More and better job training • Improved fraud deterrents 27
State of the Industry—A Recap Positives: • Results are improving • Frequency continues to decline Negatives: • Medical severity continues rapid growth 28
MarylandWorkers Compensation System—An Overview • Decrease in the medical and indemnity loss ratios • Several cost drivers contribute to rising costs • Average Permanent Partial (PP) indemnity claim cost higher than countrywide PP average indemnity claim cost by 18% • Higher average Vocational Rehab (VR) claim costs as compared to the countrywide average VR claim cost • High involvement by attorneys • Claim frequency continues to decline • Indemnity severity has decreased while medical severity continues to increase • High permanent partial disability frequency, but lower average claim costs than the region 30
Maryland Accident Year Combined Ratios Source: NCCI financial data, NAIC Annual Statement data. 31
The Impact on Premium of Rate/Loss Cost Departures, Schedule Rating and Dividends in Maryland Dividend ratios are based on calendar year statistics. Based on data through 12/31/03 for the states for which NCCI provides ratemaking services. . 32
Current Average Voluntary Pure Loss Costs Using Maryland’s Payroll Distribution Based on the latest NCCI published rates and loss costs in the various states. 33
Maryland’s Loss Ratios Continue to Decrease Based on NCCI’s financial data. 34
Maryland’s Filing Activity Voluntary Loss Cost Changes No filing Law-only filing 36
Maryland’s January 1,2005Voluntary – Proposed Filing Summary • Indicated Change Based on Experience + 1.6% • Indicated Change Based on Trend + 0.0% • Indicated Change in Benefits*+ 1.8% • Indicated Change in Experience, Trend & Benefits + 3.4% • Overall Indicated Change + 3.4% • * Benefit Changes +0.5% : Increase in Maximum Weekly Benefit +0.7% : Impact of change in Hospital Fee Schedule +0.5% : Impact of Change in Medical Fee Schedule 37
Maryland’s January 1, 2005 FilingAverage Changes by Industry Group 38
What Drives Changes in Frequency and Severity? • System changes • Economic developments/prospects • Demographic developments/prospects 40
Frequency Continues to Decline in Maryland Based on NCCI’s financial data. Frequency of lost-time claims. 41
Maryland’s Claim Frequency Compared to Other States in the RegionFrequency per 100,000 Workers—All Claims Total = 4,178 Total = 3,884 Total = 1,393 Based on NCCI’s WCSP data. 42
Medical Only Temporary Total Permanent Partial Permanent Total/Fatal Distribution of Frequency by Injury Type Maryland District of Columbia Virginia Based on NCCI’s WCSP data. 43
Maryland’s Incidence Rates for CasesWith Days Away From Work Source: U. S. Department of Labor 46
Incidence Rates By Industry in Maryland 1992 2002 Source: U. S. Department of Labor 47
Distribution of Maryland Lost-Time Claims Source: NCCI Detailed Claim Information Database 48
Relative “Riskiness” of NCCI Industry Groups Ratio of Pct. Of Maryland Lost-Time Cases to Pct. Of Private Employment, 2002 Source: Economy.com and NCCI 49
Job Growth in Maryland: Forecast Gains in 2004–2005 Source: U.S. Department of Labor and Economy.com 50