Download
1 / 18
180 likes | 282 Views
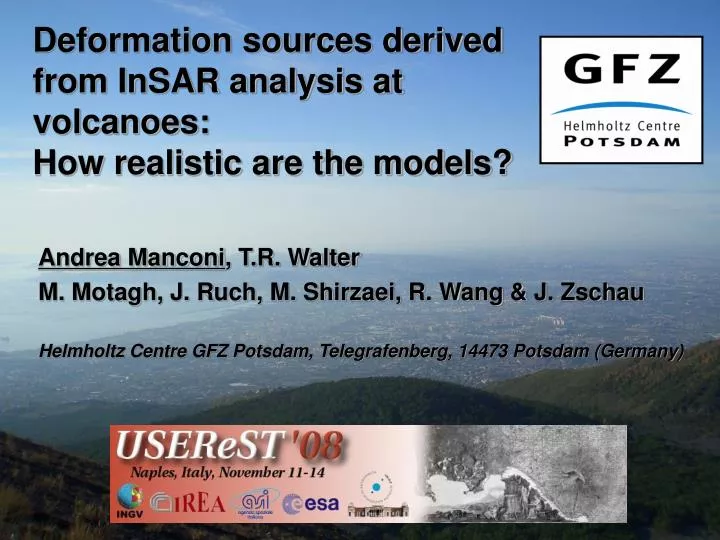
Deformation sources derived from InSAR analysis at volcanoes: How realistic are the models?. Andrea Manconi , T.R. Walter M. Motagh, J. Ruch, M. Shirzaei, R. Wang & J. Zschau Helmholtz Centre GFZ Potsdam, Telegrafenberg, 14473 Potsdam (Germany). Volcanic unrest:

E N D
Deformation sources derived from InSAR analysis at volcanoes: How realistic are the models? Andrea Manconi, T.R. Walter M. Motagh, J. Ruch, M. Shirzaei, R. Wang & J. Zschau Helmholtz Centre GFZ Potsdam, Telegrafenberg, 14473 Potsdam (Germany)
Volcanic unrest: Inflation/deflation of the magma chamber, dyke/sill intrusion, hydrothermal activity, ring fault dislocation… Surface displacement Geodetic data (InSAR) Inversion Source depth, volume/pressure change, position, shape, orientation, evolution over time… Interpretation
Model’s Assumptions - Simplified geometries (points, spheres, rectangular planes, ellipsoidal, etc.) - Earth’s lithosphere is an elastic, isotropic, and homogeneous half-space… Skaergaard, Greenland …however, in nature volcanic plumbing systems and volcanic areas look differently! Gran Canaria, Spain
Homogeneous models and layered models may lead to the same fitness of the data, but… (Darwin Volcano, Galápagos, ca. 20 cm uplift between 1992-1998 Amelung et al., 2000) L A Y E R E D …differences in the source parameters (Depth and Pressure) are up to 60% depending on the mechanical contrast Manconi et al., 2007 Pritchard et al., 2004; Trasatti et al., 2005; Newman et al., 2006; Ellis et al., 2007; Crescentini et al., 2007; Masterlark, 2007; Amoruso et al., 2008; etc…
View from Vesuvius crater CAMPI FLEGREI CALDERA WE ARE HERE ! NAPOLI Bay
Long and accurate observation of the surface displacements… SBAS-DInSAR (1992-2008, ERS – ENVISAT), M.Manzo, G.Zeni, P. Tizzani, E. Sansosti & R.Lanari
…Standard approach: joint inversion of Asc & Desc data assuming as source a Mogi source. rms=0.3 cm/year
A priori information about the sub-surface structure Zamora et al., 1994 Judenherc et al.,2004 Chiarabba et al., 2006 Berrino et al., 1998
Chiarabba et al., 2006 Low Vp/Vs anomaly 3 km depth Seismicity between 2-4 km depth During unrest, gas chemistry and gravity changes compatible with hydrothermal reservoir (De Natale et al., 1991, Chiodini et al., 2001; Battaglia et al., 2006) 3-D Finite Element models constrained by independent geophysical observations and constraints Forward model considering 20 MPa overpressure(Sartoris,1990) Our FE model
Forward model on a 3D heterogeneous medium Inversion using Mogi and assuming an “equivalent” homogeneous half-space rms=0.3 cm/year
The surface displacement U(x,y,0) is linearly related to the source strengthDP Synthetic displacement on 3D Finite Element heterogeneous model (3DHET) Best-fit model assuming an “equivalent” homogeneous half-space (HHS) INVERSION DPHHS > DP3DHET DP3DHET 3DHET HHS This procedure retrieves the source location (coordinates and depth) but OVERESTIMATES the pressure changes…
If we consider the same source parameters (x, y, z, DP) in both models… U3DHET 3DHET UHHS <U3DHET HHS “K” represent the factor of amplification or reduction of the surface displacements due to the 3-D heterogeneities
Applying this “correction factors” to the real data… InSAR Data “corrected” for the 3D heterogeneity effects “Reality” Similarly to seismology applications, “correction factors” might be calculated for every “station” to take into account the local effects and will be then applied to the real measured data The inversion of UInSAR* will retrieve pressure changes as they occur in a fully 3D heterogeneous model!
A priori constraints ? UInSAR 3D FEM Synthetic tests Inversion The source position is not affected (like CF) Interpretation
Standard approach “Corrected” dataset
Application to the complete SBAS time series Manconi et al., in preparation
Summary and Conclusion • The use of InSAR data alone to constrain source parameters MAY lead to uncertainties! • The simplified analytical models fit the data…Numerical tests help to understand why! • Good news…under certain conditions we can still use the simplified models (e.g. monitoring)!