Download
1 / 22
220 likes | 351 Views
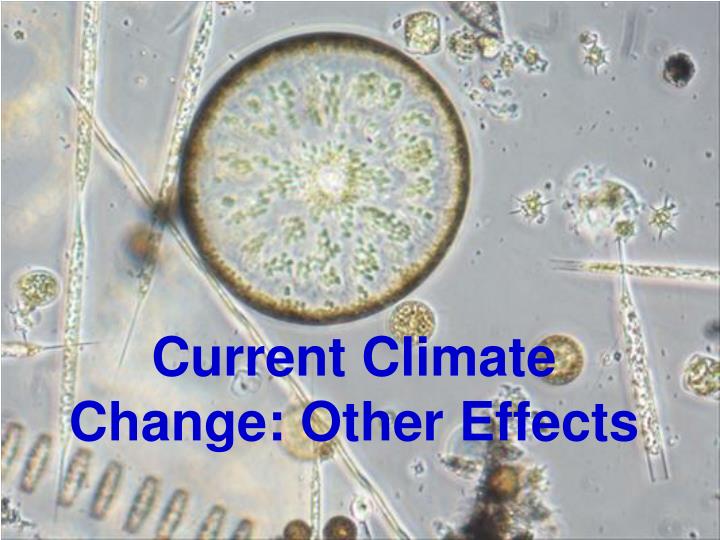
Current Climate Change: Other Effects. Global phytoplankton has declined by an alarming 40% from 1950 to 2010 (Scientific American ref to Canadian research study). Warmer, more stratified ocean surface waters inhibit nutrient mixing from below and thus limit growth, is likely important here

E N D
Global phytoplankton has declined by an alarming 40% from 1950 to 2010 (Scientific American ref to Canadian research study) • Warmer, more stratified ocean surface waters inhibit nutrient mixing from below and thus limit growth, is likely important here • The stratosphere is cooling, as rising stratospheric CO2 gets less IR from below but itself radiates more IR because of collisional excitation followed by radiative de-excitation. We showed this earlier in the Ocean/Atmosphere PowerPoint.
Fresh Meltwater 2.7% Less Dense than Seawater, Inhibiting Polar Sinking and Global Conveyor Currents
Multiple Observational Evidence for Rapid Climate Change, Not Just Thermometers
Night Temperatures Rising Faster than Day Temperatures… • …causes a decrease in the daily temperature range (DTR), which has been observed (Braganza 2004). • This too is a unique prediction of greenhouse effect warming (Alexander 2006). Why? Because temperatures reflect the integrated heating that has already happened during the day, so that peak temperatures occur in the late afternoon, not at noon as you'd naively expect if there were no lag. The hot ground can't efficiently radiate away this heat because it is trapped by CO2, and this keeps night-time temperatures warmer. • Daytime temperatures are warmer too but not as much as night time temps, because it is not increased incoming sunlight that is causing Global Warming, it is human-caused greenhouse gases inhibiting re-radiated cooling, which happens mostly late evening. • Note in the mid/late 20th century data cooling by human-generated aerosol pollution caused daytime temperatures to stay roughly constant in spite of increasing CO2, while nighttime temperature actually increased (Wild, Ohmura, and Makowski 2007). • This data, however, is not as conclusive as it might appear. The DTR is a subtraction of two datasets which have noise, and is therefore noisier. Also, rising human-caused aerosols also affect night vs day temperatures in ways not well quantified yet. So, this evidence for greenhouse warming should be considered not very strong
Night-time minimum temps are rising faster than are daytime maximum temps, although both are rising.
Rising Ocean Temperatures Equal More Thermal Energy – Models Predict Rising Hurricane Power, which we are seeing • Rising ocean temperatures are not predicted to make MORE hurricanes, but they ARE predicted to (on average) make them stronger. • Higher sea surface temperatures drive stronger convection and more powerful storms, by straightforward physics, and this is confirmed by data for the past 30 years…
…Driving Stronger Hurricane Winds | Analysis and model results of satellite-derived tropical cyclonelifetime-maximum wind speeds. a: Box plots by year. Trend lines are shownfor the median, 0.75 quantile, and 1.5 times the interquartile range. b: Trends in global satellite-derived tropical cyclone maximum wind speeds by quantile, from 0.1 to 0.9 in increments of 0.1. Trends are estimated coefficients from quantile regression in units of metres per second per year. The point-wise 90% confidence band is shown in grey, under the assumptionthat the errors are independent and identically distributed. The solid red line is the trend from a least-squares regression of wind speed as a function of year and the dashed red lines delineate the 90% point-wise confidence bandabout this trend.
What About Tornadoes? • Tornadoes are smaller and occur over land, w/o the same water-condensation driver as hurricanes. • Data is not good enough yet to say whether we see or expect stronger tornadoes as global warming ramps up. • Disregard Richard Muller’s simplistic claim that tornadoes are perhaps weakening with global warming – he doesn’t understand how to interpret the data.
Why is This Happening? • It’s Humans. We’ve raised CO2 levels from ~280 ppm to 400 ppm in just the last 130 years, and it’s accelerating rapidly. • How? By sheer population and dominance. As recently as 1900, wild mammals made up ~50% of the vertebrate land biomass. Now, only 3%. • Humans and their livestock make up 97% of the vertebrate biomass on land (Bodley 2008), and 72% of ALL vertebrate biomass on land or sea. (90% of the large fish have already been fished out, so that makes our domination that much easier). • 36% of the primary productivity of the entire planet has been diverted to humans (Haberl, et al. 2012), while at the same time we have diminished global primary productivity since 1950 by fully 40% (!)
90% of all large fish are already gone. • Over-fishing, corals dying due to acidification, phytoplankton base of food chain • At this popular Florida boating spot catering to fisherman, the biggest catch o’ the day fisherman gets his photo taken with his catch. • Note how the fish sizes have changed over the past 50 years…