Download
1 / 40
430 likes | 745 Views
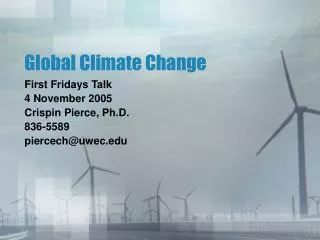
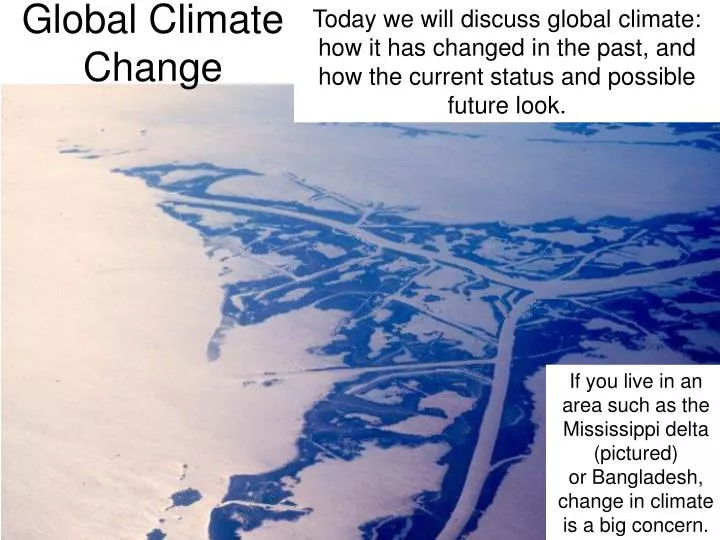
Today we will discuss global climate: how it has changed in the past, and how the current status and possible future look. Global Climate Change. If you live in an area such as the Mississippi delta (pictured) or Bangladesh, change in climate is a big concern. Climate Components.

E N D
Today we will discuss global climate: how it has changed in the past, and how the current status and possible future look. Global Climate Change If you live in an area such as the Mississippi delta (pictured) or Bangladesh, change in climate is a big concern.
The study of Earth’s climate tends to separate into two fields: analysis of recent (historical) climate, and investigation of past climate. We study climate in the geological record in order to answer the question: How has climate behaved owing to completely natural forces, not influenced by mankind? Global Climate: Past, Present, Future In order to accurately predict the coming climate, it is crucial to understand how past climate may have changed.
In studying paleoclimate, a few broad features are immediately apparent: First, global climate appears to have been warmer than current through most of the last billion years. Second, there have been punctuated periods of global cold temperatures throughout Earth history. Causes of these ice ages require some investigation. Ice Ages
During most of Earth history, global temp. was 8-10°C warmer than today, but there have been a few long periods of sustained globally cold periods. Paleoclimate Cycles ice ages: 2500 Myr, 700 Myr, 300 Myr and 42 Myr
How to Change Global Climate The ways in which global climate may be influenced include: • changes in Earth’s orbit • variable solar output • changes in ocean circulation patterns • albedo (reflectivity) effects • greenhouse effect
Milankovitch described changes in the amount of solar radiation received by the Earth in terms of astronomical properties: changes in the orientation of the Earth in space that regularly repeat. Milankovitch Cycles: Tilt and Obliquity
Precession is the ‘wobble’ of the Earth on its axis. Variation in precession changes the amount of energy received by the Sun. When the cycles of tilt, obliquity and precession align, we should expect periods of elevated or diminished global temperature. Milankovitch Cycles: Precession
It appears that our Sun does not transmit a constant intensity of radiation: observations indicate a variability of 0.1-0.2%. If solar output decreases for a period of time, it causes cooling on Earth. Although sunspot activity is cyclical (22 years), we do not currently have an accurate concept of how solar output has changed (and will change) on longer time scales. Solar Output
Milankovitch Cycles and sunspots as we understand them affect climate on time scales too short to explain Ice Ages. Paleoclimate Cycles Coincidence of global cold periods with major tectonic events suggests important feedbacks between tectonics and climate.
Plate tectonics can affect climate in a variety of ways. Since ocean and atmosphere circulation are linked, any process that changes one, forces the other, which affects climate. Plate Tectonics and Climate Closing and opening seaways (e.g., Panama, SE Asia) is an obvious link between plate tectonics and climate.
Materials absorb and reflect solar radiation to different extents. Ocean water is much more absorbent than land masses, so that continents reflect a lot more solar energy back into space than the oceans. Land Mass Distribution and Climate The Earth receives more solar radiation at low latitudes (near equator) than near the poles. An Earth with land masses clustered at low latitudes would reflect more solar energy into space, resulting in a cooler planet than one with more equatorial ocean area.
Albedo is reflectivity: materials like ocean water have low albedo whereas land masses have moderate albedo. The highest albedo is snow and ice (very light in color). Hence, periods when polar ice becomes very extended will promote further cooling. This is a positive feedback mechanism. Albedo and Climate Dust in the atmosphere has the same effect: it forms a high albedo veil around the Earth, so that much solar radiation is reflected before it reaches the surface. The dust may come from dry climate periods, volcanic eruptions or other means.
The Greenhouse Effect The most important greenhouse gases are H2O, CO2 and CH4 (methane). Without this effect, the Earth would be cold and inhospitable. Taken too far to the other extreme, the Earth could evolve into a hothouse.
Plate Tectonics and CO2 p.556 Plate tectonics affects atmospheric CO2, which factors into climate through the greenhouse effect. Volcanoes produce CO2. If global volcanism slows, as would be the case when supercontinents stabilize, less atmospheric CO2 would trigger global cooling. Increased volcanism puts more CO2 in the atmosphere and results in more greenhouse warming.
Greenhouse Gases and Global Temperature There is no debate over the validity of the greenhouse effect. The question is whether the climate fluctuations of the last 160,000 yr were brought on by greenhouse gas variations or if global climate changed greenhouse gas abundances.
Ancient records such as the figure below are necessarily low resolution: we can only define large-scale climate changes. Paleoclimate Resolution When we move closer in time to the present, the resolution improves and we can address questions about the real rate of natural climate change.
Although climate in the last million years has been dominantly colder than today, we are able to resolve rapid, short-term fluctuations from cold to warm. Indeed, as we probe geological records of climate more closely, we see changes from interglacial (warm) periods to glacial periods that take < 400 years. Climate of the Last Million Years
Coring Continental Ice Ice cores with climate records of the last ~160,000 yr have been collected in the ice sheets of Greenland and Antarctica.
Working With Glacial Ice Layering in the ice provides a time record, just like varved lake sediments. Geologists examine the stable isotope compositions and trapped gas contents (CO2 and CH4) of ice cores.
Oxygen Isotopes in Ice Cores How does glacial ice record tell air temperatures? Oxygen has three isotopes, all of which are non-radioactive (stable). As precipitation forms in clouds, a certain proportion of each of the oxygen isotopes goes into the rain or snow. The exact proportion is temperature dependent. As temperature drops, oxygen in precipitation incorporates a larger proportion of isotopically light 16O relative to heavy 18O. Thus, oxygen in glacial ice acts as a thermometer of past air temperature.
Global Oxygen Isotope Correlations Oxygen isotope temperature data from different Greenland ice cores demonstrate the same trends. CO2 contents of ice cores mimic the changes in temperature from oxygen isotopes.
Glacial ice gets us back <1 Myr ago: how do we construct geologically extensive climate records? Since sea surface temperature is linked to atmospheric temperature, we can use organisms that live in the oceans. Again, these organisms take in oxygen and the oceanic oxygen budget is isotopically proportional to temperature, due to differences in the oxygen that evaporates. More light oxygen is lost to evaporation in cold times, so low temperature sea water has high ratios of 18O/16O. Organisms growing in these waters take on the ambient oxygen isotope composition. Oxygen Isotopes in Ocean Sediments
Ocean Records from Coral Reefs Corals grow in shallow marine environments and are sensitive to changes in ocean temperature, and are indicators of past sea level. Corals also can be precisely dated, so with them we can construct detailed records of how ocean temperature+sea level have changed over the last several million years.
Pollen and Climate Change Pollen grains in sediment give an estimate of types of vegetation prevailing in an area, which is linked to climate.
Tree Rings and Climate Change Structure of tree rings give another estimate of relative moisture and temperature conditions. By selecting specific types of trees, we can examine stresses of extended cold or warm periods with very high resolution back to several thousand years.
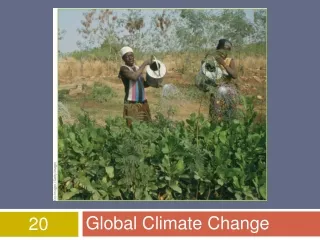
Greenhouse Gas Production Today (global) Obviously, since humankind is a major greenhouse gas producer, we need to consider the possibility that our activities affect global climate.
CO2 Emissions in the U.S. A large amount of CO2 is produced in generating electricity (most power plants burn carbon-based fuels). What can you do to reduce CO2 emission? - drive fuel efficient vehicle - use public transportation - use energy efficient appliances
No Matter How it is Measured: We are pumping greenhouse gases into the atmosphere at an alarming rate which shows no sign of slowing.
Twentieth Century Temperature The question remains: is this global climate change all our fault? If so, consider that the IPCC suggests a global increase of 1.4 to 5.8oC by 2100 given current greenhouse gas emissions.
Change in Global Temperature, Second Half of the 20th Century
ground-based data The Global Temperature Debate Understanding (quantifying) changes in global temperature, like changing sea level, is difficult. satellite data We need to understand if any change in global climate we have detected over the last century is dominantly a natural phenomenon or if we are driving climate to extreme, potentially irreversible conditions.
Global ocean circulation can be slowed by changes in water budgets. Adding fresh water (from melting glaciers, etc.) slows circulation. Too much fresh water has the potential to shut the system down. What if... What would happen if the global ocean conveyor belt shut down?
If We Push Global Climate, Will We Suffer Unpleasant Consequences?
Consequences of Global Warming • The west Antarctic ice sheet contains more than 3.2 million km3 of ice and is the last on Earth resting in a deep marine basin. • It is the most likely player in any future sea level rise. • Marine ice sheets are unstable and vulnerable to collapse. • Collapse and melting of this ice sheet alone would raise sea level by 6 meters (19 feet).
US Sea Level on a Warmer Earth If current ice sheets melt, you can kiss Florida goodbye. Some would not be upset, many would be.
Credits Some of the images in this presentation come from: Plummer, McGeary and Carlson, Physical Geology, 8/e; Press and Siever, Understanding Earth, 3/e; Geological Society of America; WCB McGraw-Hill Virtual Research Library; Swedish EPA; www.CO2science.com