Download
1 / 53
540 likes | 660 Views
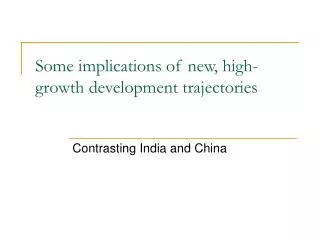
Trajectories of Change: Farming System Futures in the highlands of Kenya. Trajectories of Change in Crop-Livestock Systems.

E N D
Trajectories of Change: Farming System Futures in the highlands of Kenya
Trajectories of Change in Crop-Livestock Systems Collaborative project of:- International Livestock Research Institute- Kenya Agricultural Research Institute- Wageningen University, The NetherlandsSponsored by:- Ecoregional Methodology Fund (The Netherlands)Data from - Smallholder Dairy Project (SDP), DFID
Project objectives • Identify patterns of evolution and trajectories of change in crop-ruminant systems, and explain the main driving forces • Model the relationships between driving factors and change in Kenya and predict systems evolution under key scenarios • Identify planning and policy interventions that enhance opportunities for, and sustainability of, smallholder producers
Approach • Work with national partners, policy advisors to design questions and analyses • Develop new analytical methods that combine GIS, survey techniques and models to predict the evolution of crop-livestock systems, and produce various decision-support tools that apply them
Approach overview Experts Research team Scenarios Drivers of change Government publications Databases Research reports Household data Spatial data Models Agricultural System Changes Maps
Study area • 34 districts in Kenya highlands • High potential area with bulk of Kenyan agriculture • Crop-livestock systems • Influence from external environment
Scenarios • Each scenario is an alternative image of how the future might unfold • Scenarios can be viewed as a linking tool that integrates • qualitative narratives about future development pathways and • quantitative formulations based on formal modelling, and available data • Scenarios can enhance our understanding of how systems work, behave and evolve, and so can help in the assessment of future developments
Scenario parameters • The driving forces are: • - Human population density • - Access to primary education • - Use of extension services • - Employment off-farm • Road infrastructure • HIV/AIDS • - Climate change • The rate of change vary by district • Using yearly rate of change, we predict change in the driving forces up to 2024 (from 2004)
Four possible development paths • This study used four possible, but simplistic development paths for agriculture in the Kenyan Highlands over the next 20 years: • Baseline scenario • Equitable growth scenario (ERS) • In-equitable growth scenario • Equitable growth scenario with climate change
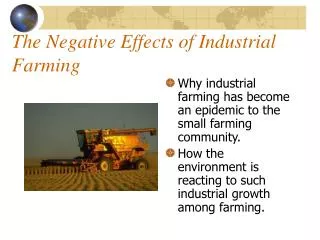
Baseline scenario • Key features: continuation of development pathways seen in Kenya in 1980s and 90s • Poorly functioning public institutions for supporting agriculture, education and market development • Market barriers internally and externally, and poor market infrastructure • Policy environment that stifles enterprise and innovation in both rural and urban economies • Result: poor economic growth, continued urban-rural migration, little ag productivity growth, continued high population growth and land fragmentation
Equitable growth scenario • Key features: mimics the plans laid out in the GoK’s Economic Recovery Strategy (ERS) • Public investment and functioning institutions for supporting agriculture and education • Physical and policy barrier to markets reduced, and infrastructure improved, both internally and externally • Policy environment that stimulate entrepreneurship and innovation in both rural and urban economies • Result: high economic growth, lower population growth, some land consolidation, improved ag productivity, reduced transactions costs in markets
In-equitable growth scenario • Key features: Imbalanced investment and public attention, with bias towards high potential areas and larger enterprises • Poor functioning institutions for supporting smallholder agriculture, with those that function biased towards larger scale players • Market barriers reduced and infrastructure improved in high potential areas, particularly where large scale production and export markets • Policy environment that facilitates innovation in large scale rural production • Result: moderate economic growth, but continued stagnation in some smallholder areas, increased wage employment in large scale production, moderate population growth, and mixed land fragmentation
Equitable scenario with climate change • Key features: same as Equitable growth scenario, but now add predicted climate change • Well functioning institutions, market barriers reduced, infrastructure improved, and improved policy environment • Kenya climate no longer assumed to retain same current patterns: Effects of greenhouse bases, global warming causes climatic change.
Modeling approach • Categorizing and mapping crop-livestock production systems • Modeling general trajectories of change under different development scenarios developed with stakeholders • Use household model to test policy interventions, and fine-tune scenario outcomes
Farming system characterization SDP survey of 3000 households Determinants of farming system choice Household data Spatial data Assessment of spatial spread of farming systems Spatial data & estimated coverage of each farming system Categorizing production systems
Farming systems characterization • Different ways of classifying agricultural households were tested: • Using factor and cluster analysis (statistical methods) but results did not prove to represent well farming systems • Using “experts’ opinion” with a logical “tree” classification
Farming systems characterization Agricultural households Non-Agricultural households Food crops only or cash crops for Domestic market only Cash crops for export No or low External inputs No/Low dairy Dairy High external inputs No dairy 23.0% 19.0% 13.9% 13.1% No dairy 14.1% Dairy 16.9% Subsistence farmers with limited dairy activities Farmers with major dairy activities Intensified crop farmers with limited dairy activities Export cash crop farmers with limited dairy activities Export cash crop farmers with major dairy activities Non-agricultural households
Determinants of farming system choice • The driving forces are: • Human population density • Access to primary education • Use of extension services • Employment off-farm • Road infrastructure • HIV/AIDS • Climate change • The rate of change vary by district (except for extension) • Using yearly rate of change, we predict change in the driving forces up to 2024 (from 2004) • The models are then used to predict farming systems change over time and over space, using the change in the driving forces
Distribution of farming systems 2004 Baseline scenario
Spatial modeling Location factors Initial land use Scenario conditions Biophysical conditions Off-farm income Population growth INPUT
Spatial modeling 2004 2014 2024 OUTPUT Land use (farming system) change
Aggregated demand • Change in demand for commodities • Maize • Beans • Tea • Milk • Driving factors • Population growth • Income (with commodity specific elasticities) • Exports • HIV/AIDS
Aggregated demand Change in demand for export cash crops with limited dairy activities Relative change Years
Aggregated demand Change in demand for subsistence farming Relative change Years
Change in occurrence of farming systems 1 Zone without large-scale farming 2 Zone with large-scale farming
Spatial patterns 2004 Baseline scenario
Spatial patterns over time 2004 2006 2008 2010 2012 2014 2016 2018 2020 2022 2024 Baseline scenario
Spatial patterns – areas with change Baseline scenario
Spatial patterns – areas with change Baseline scenario
Spatial patterns – areas with change Baseline scenario
Spatial patterns – inequitable In-equitable Equitable
Climate change scenario • Results almost identical to equitable growth scenario • Climate change impact relative small within considered time frame (20 years) • Suggests that Kenya highlands not likely to be significantly affected by climate change during this period
Poor people per farming system Current situation
Poor people per farming system 100 Percentage of rural poor 50 0 Baseline Equitable In-equitable Equitable* Farming system
Change in number of poor people Baseline Equitable In-equitable
Results household model Under baseline scenario of low growth, dairy activity in this example farm declines between 2005 and 2024 Farmers with major dairy, baseline scenario
Results household model Under equitable scenario of higher growth and land consolidation, grass for dairy in this example farm increases between 2005 and 2024 Farmers with major dairy, equitable scenario
Summary • Subsistence farming is likely to decrease in Kenya, even under the less optimistic baseline scenario, shift to more intensive food crops and dairy production • In all scenarios there is likely to be a shift away from farming to non-agricultural households. • Only increase in subsistence farming could occur in inequitable scenario, in the less favoured areas. • Unlike perhaps other parts of Kenya, the highlands of Kenya may not be significantly impacted by climate change.
Summary • These results are only indicative of potential changes under rather simplistic scenarios, and so should not be seen as definitive • Their main purpose is to stimulate interest and further development in these types of analytical methods by national institutions • Future plan – apply the same approach to data from Western India (Gujarat). Relevant for agricultural change research in a number of settings.
How to enhance institutionalization of ecoregional research? Survey of recent Ecoregional projects found: • Engage with policy-makers & drafters, and other users early and frequently • Address real problems of interest • Develop user-friendly materials, including user manuals, web materials, policy briefs • Promote capacity building with partners, including formal training and short courses • Seek additional resources for continued development and use
Engage with policy-makers • Various meeting • 7 August 2003 - Panel of experts • 25 February 2004 - Stakeholders • 23 November 2004 - Local experts • 29 April 2005 - Panel of experts • 22 June 2005 – Stakeholders • To address real problems of interest – link to ERS
Documentation of Ecoregional tools User’s manuals of IMPACT and CLUE Review report of statistical methods for eco-regional research Peer-reviewed report published in the IGBP/IHDP LUCC report series (no. 7)
Documentation of Ecoregional tools www.trajectories.org
Promote capacity building with partners • The TOC project organised a 5-day training June 13-17 to familiarise 6 “trainees” with the approach on farming system change and the two modelling approaches used within the project • During the last day, the trainees brainstorm on possible future projects. Three concept notes are currently under development, to be finalized in workshop end Sept.