Download
1 / 16
160 likes | 268 Views
How to Use PowerPoint in Scientific Talks. How to present numerical results without boring or confusing people How to give statistics or citations without distracting your audience How to animate, simply and effectively. Trends with Margined Sculpin.

E N D
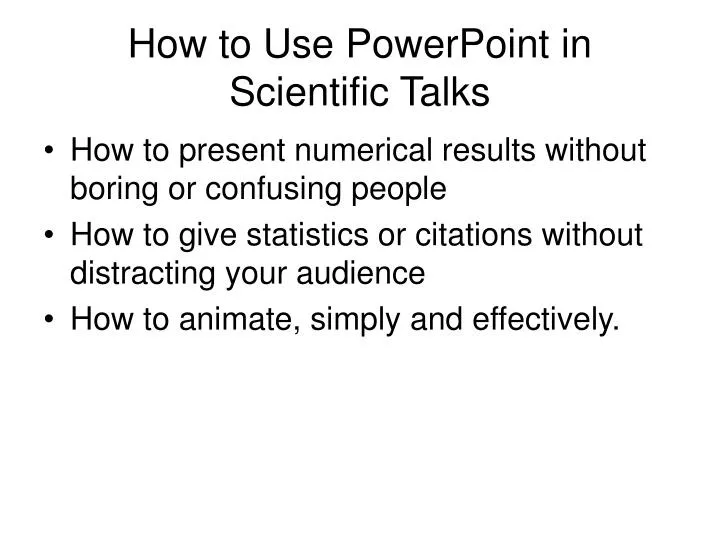
How to Use PowerPoint in Scientific Talks • How to present numerical results without boring or confusing people • How to give statistics or citations without distracting your audience • How to animate, simply and effectively.
Trends with Margined Sculpin always give sample size with graphs and such n = 17 r2 = 0.580 P = 0.015 If Excel gives you labelling problems, crop off the labels and rewrite them larger, in bold, with units, in Powerpoint.
PC1 = 39% of variance = Size Geomorphology Lack of boulders Abundance of “other” fishes PC2 = 18% of variance = Fish Lack of Paiute sculpin Abundance of “other” fishes Habitat Variation Among Sites Draw SHORT, plain English conclusions on slide. Or, draw leading questions
Sites with / without Margined • t-tests on PC-loading variables • only 1 variable significant • Sites with margined had more salmonids >100mm FL (P=0.04) • Salmonid-poor waters often had no fish of any kind Rather than give 20 graph slides, just results are summarized after an example graph
What environmental parameters explainMargined Sculpin summer distribution? • Which variables contribute most to site differences? • Stream size biggest difference, but margined don’t mind List some simple, plain-English questions at the beginning. Then copy and paste it later into the talk, but now you can supply answers. • Are sites with/without Margined Sculpin different at an individual variable? • No, not really • Trends between Margined Sculpin CPUE and individual variables? • Only for Paiute Sculpin
Groupers are Exploited US Commercial Harvest : Commercial = $ 2.68 million Recreational << $ 8.35 million Cyanide Fishing Industry: Asian live reef fish restaraunts Europe / US pet trade Wholesale prices up to $16 / lb. Here are my citations, readable for those interested, but not bothersome to those who’d be bored by them Sources: Fisheries of the United States 2001, National Marine Fisheries Service; Hong Kong Fish Marketing Org., 3 Jan 04
Epi adscensionis 2 Epi miliaris Epi maculatus Epi bleekeri Var louti Epi sp. Epi polylepis Epi cyanopodus Epi merra 2 Epi analogus Epi quoyanus 2 Epi nigritus Epi guttatus Epi striatus Epi morio 2 Epi tauvina 2 Epi adscensionis 3 Myc fusca 2 Epi marginatus 2 Myc tigris 2 Myc venenosa 2 Myc bonaci Myc phenax Myc microlepis Epi fasciatus Epi caeruleopunctatus 4 Cro altivelis Any leucogrammicus 2 Epi polyphekadion Epi itajara 3 Epi merra Epi niveatus Epi niphobles Epi nigritus Epi flavolimbatus Cep fulva 2 Cep taeniops 2 Ple maculatus Var louti 2 Var albomarginata Grammistini Ryp saponaceous 12 Cep cruentata 3 Cep nigri Ste gigas Polyprionidae Ple laevis 2 Ple leopardus 2 Aet rogaa Grouper Genealogy Color code complicated pictures into 2-4 categories. Move technical details to smaller font out of the way Nuclear DNA Intron 6 from LDH-A gene No outgroups amplified Little resolution Polyphyletic species Questionable utility??? Most parsimonious consensus cladogram by TBR500 swapping & 200 bootstraps Indels treated as fifth base; equal weighting at all positions
Animation of Points, Pt. 1 I highlighted every bulleted point and every word under the cartoon nose. Then for each, I did this: Slide Show Custom Animation Add Effect Entrance Appear That makes 8 lines appear with every click of spacebar. Human Scent reflects MHC (disease resistance genes) Reproductive condition Artificial scents Microbial action DNA Hormones Cologne Stank
Animation of Points, Pt. 2 I then went to the Custom Animation toolbar and choose “6 DNA” Re-Order, Up arrow Moved DNA until it was just after MHC Start, With Previous (instead of On Click) Human Scent reflects MHC (disease resistance genes) Reproductive condition Artificial scents Microbial action DNA Hormones Cologne Stank
Animating without Animating • It is sometimes simpler to get an effect by copying the slide over and over to get an animated-like effect. • I prefer this method when displaying multiple graphs.
S0 By copying and pasting a graph slide many times, you can watch the lines and text change as IF it was animation… Trying viewing this by hitting the space bar fast. Title Factor X and Y control S
By copying and pasting a graph slide many times, you can watch the lines and text change as IF it was animation… Trying viewing this by hitting the space bar fast. Title Factor X decreases S1
S2 By copying and pasting a graph slide many times, you can watch the lines and text change as IF it was animation… Trying viewing this by hitting the space bar fast. Title Factor Y decreases
S0 By copying and pasting a graph slide many times, you can watch the lines and text change as IF it was animation… Trying viewing this by hitting the space bar fast. Title Factor X and Y both control S S1 S2