Download
1 / 14
170 likes | 310 Views
Color Image Analysis. Chaur-Chin Chen Institute of Information Systems and Applications Department of Computer Science National Tsing Hua University E-mail: cchen@cs.nthu.edu.tw Tel: +886 3 573 1078. Color Image Processing. Three Primary Signals : Red , Green , Blue

E N D
ColorImageAnalysis Chaur-Chin Chen Institute of Information Systems and Applications Department of Computer Science National Tsing Hua University E-mail: cchen@cs.nthu.edu.tw Tel: +886 3 573 1078
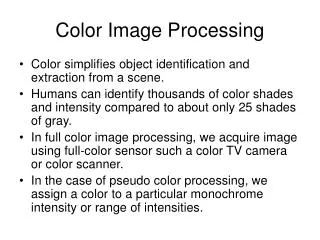
Color Image Processing • Three Primary Signals: Red, Green, Blue • Representation of (R,G,B) Color Images • A Palette of 256 colors from HP Hex Triplet Color Chart • RGB and HSI Conversion • RGB and YIQ Conversion
From JPEG to RGB • m=512; n=512; npixel=m*n; • I=imread('koala512.jpg'); % m * n * 3 = (R,G,B) • R=I(:,:,1); G=I(:,:,2); B=I(:,:,3); • hR=zeros(256); hG=zeros(256); hB=zeros(256); • for i=1:256 • for j=1:256 • r=1+R(i,j); g=1+G(i,j); b=1+B(i,j); • hR(r)=hR(r)+1; • hG(g)=hG(g)+1; • hB(b)=hB(b)+1; • end • end • for k=1:256 • hR(k)=100.0*(hR(k)/npixel); • hG(k)=100.0*(hG(k)/npixel); • hB(k)=100.0*(hB(k)/npixel); • end • subplot(2,2,1) • imshow(R) • subplot(2,2,2) • imshow(G) • subplot(2,2,3) • imshow(B) • L=0:255; • subplot(2,2,4) • plot(L,hR,'r-',L,hG,'g-',L,hB,'b-') • title('RGB Histograms of 512 \times 512 Koala512') • xlabel('Intensity Levels') • ylabel('Percentage %')
Red = FF0000 Green = 00FF00 Blue = 0000FF Cyan = 00FFFF Magenta= FF00FF Yellow = FFFF00 RGB Hex Triplet Color Chart
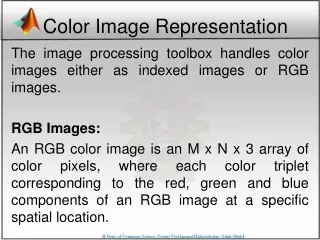
Hue, Saturation, Intensity (HSI) • Hue is a color attribute that describes a pure color, e.g., pure orange, pure green, pure cyan, whereas Saturation is a measure of the degree to which a pure color is diluted by a white light. Brightness (Intensity) is a subjective description that is practically impossible to measure. • HSI is an ideal tool for developing image processing algorithms based on color description that are natural intuitive to humans.
RGB ←→ HSI • I = (R+G+B)/3 • S=1-3*min{R,G,B}/(R+G+B) =1-min{R,G,B}/I • H=θ if B ≤ G, = 2π- θ if B >G, where Θ=cos-1 {0.5[(R-G)+(R-B)]/[(R-G)2+(R-B)(G-B)]1/2} • B=I*(1-S) • R=I*{1+S*cos(H)/cos[(π/3)-H]} • G=1-(R+B)
RGB ←→ YIQ • Convert (R,G,B) signals into uncorrelated (Y,I,Q) components for further processing and analysis, for example, compression • Y=0.299R + 0.587G + 0.114B • I =0.596R - 0.275G - 0.321B • Q=0.212R – 0.523G + 0.312B