Download
1 / 1
10 likes | 180 Views
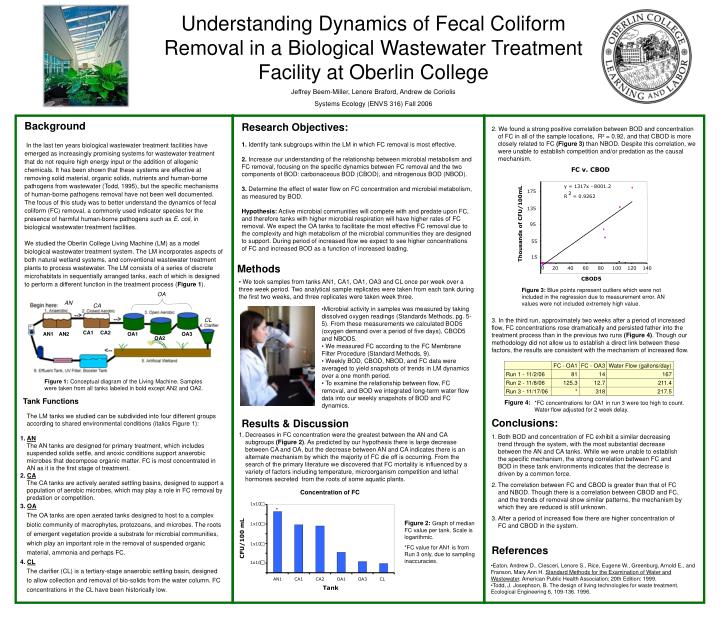
Research Objectives: 1. Identify tank subgroups within the LM in which FC removal is most effective.

E N D
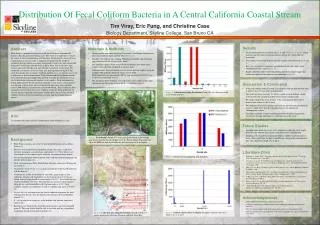
Research Objectives: 1. Identify tank subgroups within the LM in which FC removal is most effective. 2. Increase our understanding of the relationship between microbial metabolism and FC removal, focusing on the specific dynamics between FC removal and the two components of BOD: carbonaceous BOD (CBOD), and nitrogenous BOD (NBOD). 3. Determine the effect of water flow on FC concentration and microbial metabolism, as measured by BOD. Hypothesis: Active microbial communities will compete with and predate upon FC, and therefore tanks with higher microbial respiration will have higher rates of FC removal. We expect the OA tanks to facilitate the most effective FC removal due to the complexity and high metabolism of the microbial communities they are designed to support. During period of increased flow we expect to see higher concentrations of FC and increased BOD as a function of increased loading. y = 1317x - 8001.2 2 R = 0.9262 FC v. CBOD 175 135 95 Thousands of CFU/100mL 55 15 0 20 40 60 80 100 120 140 CBOD5 OA AN CA CL CA1 CA2 AN1 AN2 OA1 OA3 OA2 Concentration of FC 1x10 * * * 1x10 CFU/100 mL 1x10 1x10 AN1 CA1 CA2 OA1 OA3 CL Tank Understanding Dynamics of Fecal Coliform Removal in a Biological Wastewater Treatment Facility at Oberlin College Jeffrey Beem-Miller, Lenore Braford, Andrew de Coriolis Systems Ecology (ENVS 316) Fall 2006 Background In the last ten years biological wastewater treatment facilities have emerged as increasingly promising systems for wastewater treatment that do not require high energy input or the addition of allogenic chemicals. It has been shown that these systems are effective at removing solid material, organic solids, nutrients and human-borne pathogens from wastewater (Todd, 1995), but the specific mechanisms of human-borne pathogens removal have not been well documented. The focus of this study was to better understand the dynamics of fecal coliform (FC) removal, a commonly used indicator species for the presence of harmful human-borne pathogens such as E. coli, in biological wastewater treatment facilities. We studied the Oberlin College Living Machine (LM) as a model biological wastewater treatment system. The LM incorporates aspects of both natural wetland systems, and conventional wastewater treatment plants to process wastewater. The LM consists of a series of discrete microhabitats in sequentially arranged tanks, each of which is designed to perform a different function in the treatment process (Figure 1). 2. We found a strong positive correlation between BOD and concentration of FC in all of the sample locations, R² = 0.92, and that CBOD is more closely related to FC (Figure 3) than NBOD. Despite this correlation, we were unable to establish competition and/or predation as the causal mechanism. Methods • We took samples from tanks AN1, CA1, OA1, OA3 and CL once per week over a three week period. Two analytical sample replicates were taken from each tank during the first two weeks, and three replicates were taken week three. Figure 3: Blue points represent outliers which were not included in the regression due to measurement error. AN values were not included extremely high value. • Microbial activity in samples was measured by taking dissolved oxygen readings (Standards Methods, pg. 5-5). From these measurements we calculated BOD5 (oxygen demand over a period of five days), CBOD5 and NBOD5. • We measured FC according to the FC Membrane Filter Procedure (Standard Methods, 9). • Weekly BOD, CBOD, NBOD, and FC data were averaged to yield snapshots of trends in LM dynamics over a one month period. • To examine the relationship between flow, FC removal, and BOD we integrated long-term water flow data into our weekly snapshots of BOD and FC dynamics. 3. In the third run, approximately two weeks after a period of increased flow, FC concentrations rose dramatically and persisted father into the treatment processthan in the previous two runs (Figure 4). Though our methodology did not allow us to establish a direct link between these factors, the results are consistent with the mechanism of increased flow. Figure 1: Conceptual diagram of the Living Machine. Samples were taken from all tanks labeled in bold except AN2 and OA2. Tank Functions Figure 4: *FC concentrations for OA1 in run 3 were too high to count. Water flow adjusted for 2 week delay. The LM tanks we studied can be subdivided into four different groups according to shared environmental conditions (italics Figure 1): 1. AN The AN tanks are designed for primary treatment, which includes suspended solids settle, and anoxic conditions support anaerobic microbes that decompose organic matter. FC is most concentrated in AN as it is the first stage of treatment. 2. CA The CA tanks are actively aerated settling basins, designed to support a population of aerobic microbes, which may play a role in FC removal by predation or competition. 3. OA The OA tanks are open aerated tanks designed to host to a complex biotic community of macrophytes, protozoans, and microbes. The roots of emergent vegetation provide a substrate for microbial communities, which play an important role in the removal of suspended organic material, ammonia and perhaps FC. 4. CL The clarifier (CL) is a tertiary-stage anaerobic settling basin, designed to allow collection and removal of bio-solids from the water column. FC concentrations in the CL have been historically low. Results & Discussion • Conclusions: • Both BOD and concentration of FC exhibit a similar decreasing trend through the system, with the most substantial decrease between the AN and CA tanks. While we were unable to establish the specific mechanism, the strong correlation between FC and BOD in these tank environments indicates that the decrease is driven by a common force. • The correlation between FC and CBOD is greater than that of FC and NBOD. Though there is a correlation between CBOD and FC, and the trends of removal show similar patterns, the mechanism by which they are reduced is still unknown. • After a period of increased flow there are higher concentration of FC and CBOD in the system. • Decreases in FC concentration were the greatest between the AN and CA subgroups (Figure 2). As predicted by our hypothesis there is large decrease between CA and OA, but the decrease between AN and CA indicates there is an alternate mechanism by which the majority of FC die off is occurring. From the search of the primary literature we discovered that FC mortality is influenced by a variety of factors including temperature, microorganism competition and lethal hormones secreted from the roots of some aquatic plants. Figure 2:Graph of median FC value per tank. Scale is logarithmic. *FC value for AN1 is from Run 3 only, due to sampling inaccuracies. References • Eaton, Andrew D., Clesceri, Lenore S., Rice, Eugene W., Greenburg, Arnold E., and Franson, Mary Ann H. Standard Methods for the Examination of Water and Wastewater. American Public Health Association; 20th Edition: 1999. • Todd, J. Josephson, B. The design of living technologies for waste treatment. Ecological Engineering 6, 109-136. 1996.