Download
1 / 17
170 likes | 178 Views
Hillsborough River Fecal Coliform BMAP Process. Oct. 22, 2008. What is a BMAP?. “Basin Management Action Plan” Developed by FDEP and local stakeholders, to identify the projects that will be carried out to reduce pollutant loads and achieve the water quality goals established by a TMDL.

E N D
Hillsborough RiverFecal Coliform BMAPProcess Oct. 22, 2008
What is a BMAP? • “Basin Management Action Plan” • Developed by FDEP and local stakeholders, to identify the projects that will be carried out to reduce pollutant loads and achieve the water quality goals established by a TMDL
What is a TMDL ? • TMDL = Total Maximum Daily Load. The maximum amount (“load”) of a given pollutant that a waterbody can receive and still meet water quality standards • WQ standards include a waterbody’s designated use (e.g., water supply, shellfish harvesting, wildlife habitat & recreational use) and the WQ criteria for that designated use • TMDLs are developed for “impaired” waterbodies – ones that are not currently meeting WQ standards –and provide WQ goals to guide future management activities
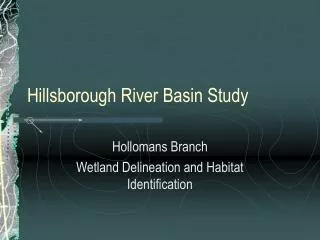
Current fecal coliform BMAP areas (“WBIDs”)in the Hillsborough River watershed
Hillsborough RiverBMAP waterbodies • All are Class III waters (designated uses = wildlife habitat and human recreation) • All have been designated as impaired for fecal coliforms and have TMDLs • Existing State criteria for fecal coliforms: • Should not exceed 400 CFU/100 mL in more than 10% of samples • Should not exceed 200 CFU/100 mL as a monthly average • Should never exceed 800 CFU/100mL
Benefits and drawbacks of coliformsas water quality indicators • Coliform bacteria have been used as relatively inexpensive indicators of potential fecal contamination of water since the late 1800s. When present at high concentrations, useful for detecting contamination of surface or groundwater by untreated or minimally-treated sewage. • But, in tropical and sub-tropical areas, fecal coliforms and other bacterial indicators can grow in soils and on vegetation, producing “false-positive” monitoring results • Can also produce “false-negative” results – e.g., under certain conditions pathogenic viruses and protozoa (Giardia or Cryptosporidium) can survive longer than fecal coliforms in water
Issues with existing indicators • Recent studies have confirmed relationships between sewage-associated enterococci concentrations and human health risk in marine waters (WHO 2003, NRC 2004) • In fresh waters, correlations between indicator (e.g., fecal coliforms, enterococci, E. coli) concentrations and health risk are present but highly variable • In tropical and sub-tropical regions, the indicators have a number of potential environmental sources that don’t pose human health risk • A recent Tampa Bay study (Rose et al. 2001) recommended continued use of fecal coliforms and enterococci as WQ indicators in this region, but with caution
How to address the shortcomings ? • NRC (2004) recommends that better indicators (more highly correlated with human health risk) be developed, based on modern molecular and microbiology techniques • EPA (and other organizations) currently working to do so • Until that happens, the WHO (2000, 2003) recommends that, for recreational waters, managers use the “Annapolis protocol”, which combines bacterial indicator counts with on-site assessments of potential pathogen sources and the health risk they pose
Geometric mean fecal coliform counts vs. exceedances of 400 CFU criterion (EPC data)
Geometric mean enterococci counts vs. exceedances of 400 CFU criterion (EPC data)
How to incorporate these ideasinto fecal coliform BMAPs ? • Use the EPC fecal coliform monitoring data as a screening tool, to identify and prioritize locations for management attention • In the impaired WBIDS, use information from “contaminant source surveys” (CSS) to supplement the bacterial data and estimate potential health risk of local sources • Use the “Annapolis protocol” approach to combine the information and guide management responses
CSS assessment categories(likelihood of fecal contaminationposing human health risks) • Very Low: No visual evidence of potential sources of human pathogens; natural environment; no or minimal anthropogenic land uses; wildlife present (any density) • Low: Low density agricultural and residential sources, including pets, livestock (without direct access to surface waters), or poultry operations; residences on septic systems • Moderate: Urban stormwater sources (including pet waste) present; well-functioning wastewater infrastructure (both sewer and septic); episodic/low volume sanitary sewer overflows (SSOs) reaching surface waters; moderate-density livestock with little direct access to surface waters; Class A residual and/or septage spreading areas may be present • High: Major stormwater outfalls present; history of failing wastewater infrastructure (central sewer or onsite systems); episodic or chronic/high volume SSOs reaching surface waters; concentrated livestock without direct access to surface waters; residual/septage spreading (Class B) • Very High: Current failing wastewater infrastructure; chronic/high volume SSOs reaching surface waters; concentrated livestock with direct access to surface waters; evidence of direct sewage inputs (e.g., confirmed illicit discharges)
Potential relevance to RAMP ? • Despite their drawbacks, the existing bacterial indicators (e.g., fecal coliforms, enterococcus, E. coli) will continue to be used for federal and state regulatory purposes until better indicators are developed and adopted. That process could take a number of years. • None of the existing indicators are included in the RAMP program, which may complicate data comparisons in WBIDs monitored by more than one program • RAMP may wish to consider adding one or more of the bacterial indicators to its parameter list, to provide quantitative information on inter-laboratory comparability of the available monitoring data
Some references… • EPA. 2007. Report of the experts scientific workshop on critical research needs for the development of new or revised recreational water criteria. EPA 823-R-07-006. Washington, DC • National Research Council. 2004. Indicators for waterborne pathogens. National Academy Press, Washington, DC • Rose, J.B., et al. 2001. Healthy beaches Tampa Bay: Microbiological monitoring of water quality conditions and public health impacts. Tampa Bay Estuary Program Technical Report #03-01. TBEP. St. Petersburg, FL • World Health Organization. 2003. Guidelines for Safe Recreational Water Environments. Volume 1: Coastal andFresh Waters. WHO, Geneva, Switzerland