Download
1 / 1
10 likes | 119 Views
Clinical input data (supplied by OHI): 4 normal subjects Short-axis oriented slices Static and Dynamic data: OSEM reconstruction, stress/rest studies 128x128 image size (17 frames for dynamic data) Phantom input data : allows objective MSE measure to quantify denoising performance

E N D
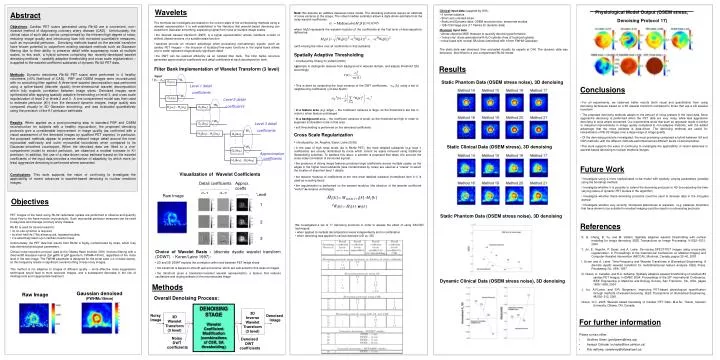
Clinical input data (supplied by OHI): • 4 normal subjects • Short-axis oriented slices • Static and Dynamic data: OSEM reconstruction, stress/rest studies • 128x128 image size (17 frames for dynamic data) • Phantom input data: • allows objective MSE measure to quantify denoising performance • “noise only” slices generated with H2O cylinder (free of localized uptake) • noise fused with normal SA slices (smoothed with 10mm FWHM Gaussian) • The static data was denoised, then evaluated visually by experts at OHI. The dynamic data was denoised, then fitted to a one-compartment Rb-82 model. Wavelets Physiological Model Output (OSEM stress, Denoising Protocol 17) Abstract Note: We assume an additive Gaussian noise model. The denoising protocols require an estimate of noise variance in the image. The robust median estimator allows a data-driven estimate from the noisy wavelet coefficients: • The methods we investigate are based on the current state of the art denoising methods using a wavelet representation. It is well-established in the literature that wavelet-based denoising can outperform Gaussian smoothing, separating signal from noise at multiple image scales. • the discrete wavelet transform (DWT) is a signal representation whose members consist of shifted, dilated versions of a suitable basis function • wavelets provide an inherent advantage when processing nonstationary signals (such as cardiac PET images) – the inclusion of localized fine-scale functions in the signal basis allows one to better represent diagnostically significant detail • the DWT can be realized efficiently as an iterated filter bank. The filter banks structure generates approximation coefficients and detail coefficients at each decomposition level. Objectives: Cardiac PET scans generated using Rb-82 are a convenient, non–invasive method of diagnosing coronary artery disease (CAD). Unfortunately, the clinical value of such data can be compromised by the inherent high degree of noise, reducing image quality and introducing bias into extracted quantitative measures, such as myocardial perfusion. Denoising methods based on the wavelet transform have shown potential to outperform existing standard methods such as Gaussian filtering due to their ability to preserve detail while suppressing noise at multiple scales. In this work, a hybrid scheme comprising two recently-developed wavelet denoising methods – spatially adaptive thresholding and cross scale regularization – is applied to the wavelet coefficient subbands of dynamic Rb-82 PET data. Methods: Dynamic rest/stress Rb-82 PET scans were performed in 4 healthy volunteers (<5% likelihood of CAD). FBP and OSEM images were reconstructed with no smoothing filter applied. A three-level wavelet decomposition was performed using a spline-based (discrete dyadic) three-dimensional wavelet decomposition which fully exploits correlation between image slices. Denoised images were synthesized after applying spatially adaptive thresholding on level 3, and cross scale regularization of level 2 or levels 2 and 3. A one-compartment model was then used to estimate perfusion (K1) from the denoised dynamic images. Image quality was compared visually to 3D Gaussian smoothing, and was evaluated quantitatively using the precision of the K1 perfusion estimates. Results: When applied as a post-processing step to standard FBP and OSEM reconstruction for subjects with a healthy myocardium, the proposed denoising protocols give a considerable improvement in image quality (as confirmed with a visual assessment of the denoised images by qualified PET experts). In particular, the proposed methods appear to preserve relevant image detail around the inner myocardial wall/cavity and outer myocardial boundaries when compared to its Gaussian-smoothed counterpart. When the denoised data are fitted to a one-compartment model to extract perfusion, we observed a modest increase in K1 precision. In addition, the use of a data-driven noise estimate based on the wavelet coefficients of the input data provides a mechanism of adaptivity, by which more (or less) aggressive denoising is performed where warranted. Conclusions: This work supports the value of continuing to investigate the applicability of recent advances in wavelet-based denoising to nuclear medicine images. where M1[k] represents the wavelet modulus of the coefficients at the first level of decomposition, defined as: (with k being the index over all coefficients in that subband). • Spatially Adaptive Thresholding • introduced by Chang,Yu,Vetterli (2000) • attempts to distinguish features from background in wavelet domain, and adjusts threshold T[k] accordingly. • This is done by computing the local variance of the DWT coefficients, sW [k], using a set of neighbouring coefficients hof size N with: • in a feature area (e.g. edge) – the coefficient variance is large, so the threshold is set low in order to retain feature unchanged • in a background area – the coefficient variance is small, so the threshold set high in order to suppress (noticeable) noise in that area • soft thresholding is performed on the denoised coefficients Results Filter Bank Implementation of Wavelet Transform (3 level) Input f [n1,..,nD] 1 W1 Static Phantom Data (OSEM stress noise), 3D denoising Gs(w1) . . . Level 1 detail coefficients Conclusions D W1 Gs(wD) Level 2 detail coefficients • For all experiments, we observed better results (both visual and quantitative) from using denoising techniques based on a 3D wavelet transform compared to those that use a 2D wavelet transform. • The proposed denoising methods adapts to the amount of noise present in the input data. More aggressive denoising is performed when the PET data are very noisy, while less aggressive denoising is done where warranted. Our experiments show that such an approach leads to similar or marginal improvements in image quality compared to non-adaptive methods, with the added advantage that the noise estimate is data-driven. The denoising methods are useful for interpretation of Rb-82 images over a large range of image quality. • Of the denoising protocols investigated, the most promising comprised a hybrid between SA and CSR methods, with the different methods performed across different levels of decomposition. • This work supports the value of continuing to investigate the applicability of recent advances in wavelet-based denoising to nuclear medicine images. 1 W2 Gs(2w1) Hs(w1)…Hs(wD) . . . D W2 Level 3 detail coefficients Gs(2wD) 1 W3 Hs(2w1)…Hs(2wD) • Cross Scale Regularization • introduced by Jin, Angelini, Esser, Laine (2002) • in the case of high noise levels (as in Rb-82 PET), the most detailed subbands (e.g. level 1 coefficients) are usually dominated by noise which cannot be easily removed using traditional thresholding schemes. To address this issue, a scheme is proposed that takes into account the cross-scale correlation of structured signals. • the presence of strong image features produces large coefficients across multiple scales, so the edges in the higher level subbands (less contaminated by noise) are used as a “oracle” to select the location of important level 1 details. Gs(4w1) . . . Static Clinical Data (OSEM stress), 3D denoising D W3 Gs(4wD) Approximation coefficients Hs(4w1)…Hs(4wD) Future Work Visualization of Wavelet Coefficients • the wavelet modulus of coefficients at the next most detailed subband (normalized from 0-1) is used as a scaling factor. • the regularization is performed on the wavelet modulus (the direction of the wavelet coefficient “vector” w remains unchanged). • Investigate using a more sophisticated noise model with spatially varying parameters (possibly using the bootstrap method) • Investigate whether it is possible to extend the denoising protocols to 4D (incorporating the time-varying nature of dynamic PET studies in the algorithm) • Investigate whether these denoising protocols could be used to denoise data in the sinogram domain • Investigate whether very recently introduced alternatives to wavelets (e.g. platelets, brushlets) that have shown to be suitable for medical imaging could be used in our denoising protocols Detail coefficients d=1 d=2 Approx. coeffs Level Raw Image Objectives 1 Static Phantom Data (OSEM stress noise), 3D denoising • PET images of the heart using Rb-82 radiotracer uptake are performed to observe and quantify blood flow to the heart muscle (myocardium). Such myocardial perfusion measures can be used to diagnose and manage coronary artery disease. • Rb-82 is used for several reasons: • no on-site cyclotron is required • its short half-life (76s) allows quick, repeated studies, • it is selectively taken up in cardiac muscle tissue • Unfortunately, the PET data that results from Rb-82 is highly contaminated by noise, which may bias derived physiological parameters. • Clinical noise reduction protocol used at the Ottawa Heart Institute (OHI) involves filtering with a fixed width Gaussian kernel (full width at half maximum, FWHM=15mm), regardless of the noise level in the raw image. The FWHM parameter is designed for the worst case (i.e. noisiest scans), so this frequently results in significant oversmoothing of less noisy images. 2 References • We investigated a set of 17 denoising protocols in order to assess the effect of using SA/CSR techniques: • when applied to multiple decomposition levels independently and in combination • when denoising was applied in various domains (2D vs. 3D) S. G. Chang, B. Yu, and M. Vetterli. Spatially adaptive wavelet thresholding with context modeling for image denoising. IEEE Transactions on Image Processing, 9:1522–1531, 2000. Y. Jin, E. Angelini, P. Esser, and A. Laine. De-noising SPECT/PET images using cross-scale regularization. In Proceedings of the International Conference on Medical Imaging and Computer-Assisted Intervention (MICCAI), Montreal, Canada, pages 32–40, 2003. I. Koren and A. Laine. Time-Frequency and Wavelet Transforms in Biomedical Engineering, A discrete dyadic wavelet transform for multidimensional feature analysis. IEEE Press, Piscataway, NJ, USA, 1997. G. Green, A. Cuhadar, and R.A. deKemp. Spatially adaptive wavelet thresholding of rubidium-82 cardiac PET images. In EMBC 2004: Proceedings of the 26th International Conference, IEEE Engineering in Medicine and Biology Society, San Francisco, CA, USA, pages 1605–1608, 2004. J. Lin, A.F.Laine, and S.R. Bergmann. Improving PET-based physiological quantification through methods of wavelet denoising. IEEE Transactions on Biomedical Engineering, 48:202–212, 2001. Green, G.C. 2005. Wavelet based Denoising of Cardiac PET Data. M.A.Sc. Thesis, Carleton University, Ottawa, ON, Canada. 3 • Choice of Wavelet Basis - (discrete dyadic wavelet transform (DDWT) - Koren/Laine 1997): • 2D and 3D DDWT exploits the correlation within and between PET image slices • the transform is based on smooth spline functions, which are well-suited to this class of images • the transform gives a translation-invariant wavelet representation, a feature that reduces oscillations and ringing artifacts in the reconstructed image This method is not adaptive to images of different quality – more effective noise suppression techniques would lead to more accurate images, and a subsequent decrease in the risk of misdiagnosis and inappropriate treatment. Dynamic Clinical Data (OSEM stress noise), 3D denoising Methods Raw Image Gaussian denoised (FWHM=15mm) Overall Denoising Process: DENOISINGSTAGE Wavelet Coefficient Modification (combinations of CSR, SA thresholding) 3D Inverse Wavelet Transform (3 level) Noisy Image Denoised Image 3D Wavelet Transform (3 level) • For further information • Please contact either: • Geoffrey Green (geoffgreen@ieee.org) • Aysegul Cuhadar (cuhadar@sce.carleton.ca) • Rob deKemp (radekemp@ottawaheart.ca) Noisy DWT coefficients Denoised DWT coefficients


