Download

1 / 34
340 likes | 442 Views
Dr John A. Schormans QMW London UK. A Summary of Engineering Rules for ATM Network Dimensioning and QoS. Quality of Service (QoS) is a user-related concept, and refers to essentially subjective quantities: - picture flicker, - annoying clicks in sound etc, - time to transfer data.

E N D
Dr John A. SchormansQMWLondonUK A Summary of Engineering Rules for ATM Network Dimensioning and QoS
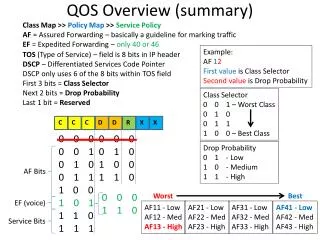
Quality of Service (QoS) is a user-related concept, and refers to essentially subjective quantities: - picture flicker, - annoying clicks in sound etc, - time to transfer data. QoS is the overall impression the user obtains from the system, from the physical layer to the application layer. The network operator should seek to guarantee the measurable network performance (NP) parameters: CTD, CDV and CLR. QoS and NP
NP parameters CTD is the total delay experienced by a cell traversing a network CDV is a measure of the variation of a cells delay in crossing the network CLR proportion of lost cells These are all quantifiable, in the long run, at least theoretically.
Experiment with real networks and applications, where available, use simulation otherwise. EXPERT project methodology
SC SC TV S TV R TV R TV R Swiss WAN SC SC 7 34 M 5 6 APON, T b SC PC TA EXPLOIT Configuration Basel Whitetree ATMLightRing pc- atm01 pc- atm02 PC MM2 TA TA 2/2 TA 002 11 Ascom ISS Cisco LS1010 Olicom OC-9100 003 1 001 2/1 1-10 Ring 1 PC MM3 2/3 Ring 2 000 12 TA 2/4 3 2 a clock pc- atm03 TA TA ASX-200 D1 T 187 B12 Italtel / Lucent APON TA Siemens EWSXpress 36190 T pc- atm04 Wandel & Goltermann B14 TA T B22 x2 ATM 100 381 ATM100 T TA Splitter B24 V V V 175 V AAU 5 115 GN Nettest B4 B2 B3 B1 IW95000 IW95000 x2 WS jupiter Alcatel TA clock ASX-200 D4 8 254 16 17,19,35 32 C1 C2 C3 C4 A1 A8643 B1 B2 B3 B4 HQA 9 TA S 24 Lucent RUM D3 Philips LaTEX WS saturn Alcatel FORE ASX-200 TA 18 4 28 A2 A8640 x2 HQA TA R 30 22 23 RUM,9 D4 11 10 31 34 20 26 WS jungfrau D2 A3 A4 D1 TA ATM: serial 155 Mbit/s, optical cellbased parallel 155 Mbit/s, electrical cellbased STM1 155 Mbit/s, electrical STM1 155 Mbit/s, optical (monomode) STM1 155 Mbit/s, optical (multimode) Taxi 100 Mbit/s, optical (multimode) serial 1,25 Gb/s, optical (cellbased) PDH 34 Mbit/s, electrical 25 Mbit/s , Twisted pair policed inputs non ATM: 2 Mbit/s CE Ethernet Frame Relay, 2 Mbit/s WS saentis TA PC TA TA PC EWSXpress, 175 11 1 5 8 Ascom AAU 4 10 7 H261 9 12, 2 N-ISDN TA Videostudio g:\aspa\platform\etb_conf\expert\vers4_6.ppt/18.8.97
Test Basel Cologne Zurich Equipment Amsterdam Leidschendam 738 km Test Basel Ottawa Montreal Pennant Hamburg Cologne Zurich Equipment Point Tele- Tele- Teaching Teaching 4575 km
1 o/p capacity ‘C’ N no. of arrivals per unit time cell scale queueing, short buffers ‘C’ time burst scale queueing, long buffers no. of arrivals per unit time ‘C’ time Different forms of buffer behaviour ...
queue size (a) all streams out of phase queue size (b) two streams in phase queue size (c) all streams in phase
X = the buffer length in cells Buffer capacity 0 10 20 30 40 1 0.1 0.01 Poisson 95% 0.001 0.0001 Poisson 75% 1E-05 CLP 1E-06 Poisson 55% 1E-07 1E-08 1E-09 1E-10
Cell rate Time ON OFF Cell rate effective bandwidth R EB Time
X X = the buffer length in cells C = the rate at which the buffer is actually being served
overflow probability vs buffer length for ON-OFF source 200 400 600 800 1000 1 0.1 overflow probability 0.01 0.001 0.0001 buffer length, X
time priorities, buffer management strategy for integration of rt-VBR and nrt-VBR priority 1 cell buffer realtime traffic priority 2 cell buffer non-realtime traffic . Cells from pr 1 buffer are served before cells from priority 2.
priority 1 cell buffer realtime traffic priority 2 cell buffer non-realtime traffic . time priorities, implications for CAC - For rt-traffic CAC needs to check that a) the new connection is acceptable to the rt-traffic, b) that it’s effect on the nrt-traffic will not violate the guaranteed NP of the nrt-traffic. - For nrt-traffic CAC needs part (b) only (due to priority mechanism).
priority 1 cell buffer realtime traffic priority 2 cell buffer non-realtime traffic . time priorities, linearity of EB approaches - Effective b/w’s have been proposed for CAC, and EXPERT experiments have been oriented towards testing the linearity of such a scheme. - Importantly: linearity was found in experiments, but also significant deviation from linearity. Such deviation can be compensated for by making the EB’s high enough.
IP data traffic with peak rate = 155.52Mbits/sec and mean rate = 22.5 Mbits/sec 1000 100 10 Instantaneous Bandwidth Mbits/sec 1 0.1 0.01 46000 47000 48000 49000 50000 51000 52000 53000 Cell Slots
Shaping cell departing at < the line rate cells arriving at the line rate, say 155Mbit/sec To shape 155Mbit/sec down to 25Mbit/sec ‘back-to-back’ cells depart separated by 6 cell slots (80% of them), or 7 cell slots (20% of them), theoretically! In practice the interface between ATM and the underlying SDH caused smaller gaps in practice.
1000 100 Peak Bandwidth Time in Seconds 10 155.52 Mbits/s 1 0.1 1 100 1000 Shaper Peak Rate in Mbits/s This is shaping applied to ftp traffic. It is the time taken to transmit a 10Mbyte binary data block
multi-media terminal, ISABEL This application was intended for the interconnection of audiences, and has was developed for the RACE & ACTS summer schools. - Tele-education / training - Telework - Telemeeting Based on SUN workstations, this means that the IP protocol stack uses all the available bandwidth during an ON period.
This is for real-time multi-media traffic, so the queueing delays must be minimal.
This is for real-time multi-media traffic, so the queueing delays must be minimal. 50 40 Queue = 100 30 Number of Sources Queue = 50 NDi/D/1 20 M/D/1 10 0 0 10 20 30 40 50 60 70 80 90 100 Shaper Rate in Mbits/s ATM output capacity was 149Mbits/sec, reducing the shaper rate down from 100Mbits/sec to 4Mbits/sec increases the number of acceptable simultaneous connections 60
In experiments Audio transmission supported by ATM suffered from imperfections (clicks, loss of sound), as a result of cell loss. A higher cell loss probability was more acceptable to users of narrowband telephony than high quality audio; this is due to the expectation of higher quality from the latter. Testers of HQ audio expected CD quality sound, but users of a narrowband telephony circuit found their conversation still understandable when 8% of cells were lost (if the distribution of cell losses was uniform). subjective assessment
Minimum QoS to CLR mapping application cell loss ratio
For the user, adding a shaper: - increases the complexity of the terminal equipment, - adds delay to the end-to-end connection (particularly a problem for AAL5 connections, as the full PDU is needed at the receiver. - reduces the peak rate of the connection, which should reduce the cost, For the network operator:- shaping reduces the ‘effective bandwidth’ of the sources, so increasing the number that can be safely multiplexed. Shaping - conclusions
Early packet discard (EPD) this whole packet is discarded, as it arrived to a queue length > than the threshold buffer size Discard threshold buffer occupancy t t t t t 1 2 3 4 5 time (cell slots) Individual cell from packet th t Arrival time of i packet i
Assumptions: 1. cells from a packet arrive instantaneously, 2. the arriving packets have a homogeneous packet size, N cells, 3. output link rate is constant, thus cell service time is deterministic, 1 cell per time unit, 4. packet arrivals are i.i.d.
TCP over ATM end-to-end reactive flow control TCP (tx) TCP (rx) potential problem with nested flow control loops ABR features ATM cell-based flow control Else UBR has cell-based transmission with no flow control
The burstiness of the rt-traffic has a significant effect on the ABR throughput: the more bursty the worse the throughput. For ATM over mobile or over satellite the TCP rate reduction mechanism has been found to be less effective than the Explicit Rate ABR feedback mechanism. The ABR mechanism offers greater precision and may be able to prevent congestion rather than simply reacting to it. Carrying TCP over CBR connections was found to be an inefficient method of transporting TCP packets. It was suggested that TCP’s “slow-start” mechanism could be redesigned to take advantage of guaranteed ATM b/w. Engineering rules for ABR
UBR with EPD same performance as standard packet networks UBR without EPD worse performance than standard packet networks ABR worse performance than UBR without EPD For TCP over ATM,the results of certain studies showed that:
It is difficult for TCP flow-control algorithms to work well in an environment where delays are large, e.g. in satellite or mobile ATM, as congestion notification is often outdated by the time it is received. Flow-control here is better provided by ABR, as this can respond faster. Carrying TCP over CBR connections does not contribute to efficient network operation. ATM can often provide a near guarantee of frame rate transmission, so TCP’s slow start algorithm is unnecessary. Recommendations
Recommendations, CTD, CDV • CTD is difficult to specify in a traffic contract, and, when building a network, the delay should be made as small as possible, as the cost to the network operator of transporting the cells across the network increases with the latency in the system: reducing the latency in the system promotes a greater turnover of customers and hence increased revenue. • rt-VBR circuits are difficult to manage when statistically multiplexed. Any “burst scale” component fills the small buffers causing low quality of service. Very low utilisation factors (less that 4%) have been found essential for unshaped traffic. Therefore shaping and/or peak rate allocating all real-time circuits may be recommended to guarantee end-to-end quality of service for CDV sensitive services.
In the past CLR of 1*10-9 have been recommended for all traffic over ATM networks. This is now very debatable, as the application and its purpose is most important in assessing the required CLR. The CLR of N-ISDN speech is quite high, 1 in 3000 cells is acceptable and with even 15% cell loss the conversation is still understandable. For High Quality CD sound the user expects to have the purest reproduction possible, else the user would much prefer to use a “music system”. So the CLR needs to be much lower: experiments used an application able to correct 1 cell in a block of 8, therefore the maximum CLR was found to be 1 in 20,000. Assuming no FEC was present, then the CLR requirement would be less than 1 in 17,000,000. Video was acceptable with higher CLR ratio e.g. 1/10,000. Recommendations, CLR