Download
1 / 11
110 likes | 190 Views
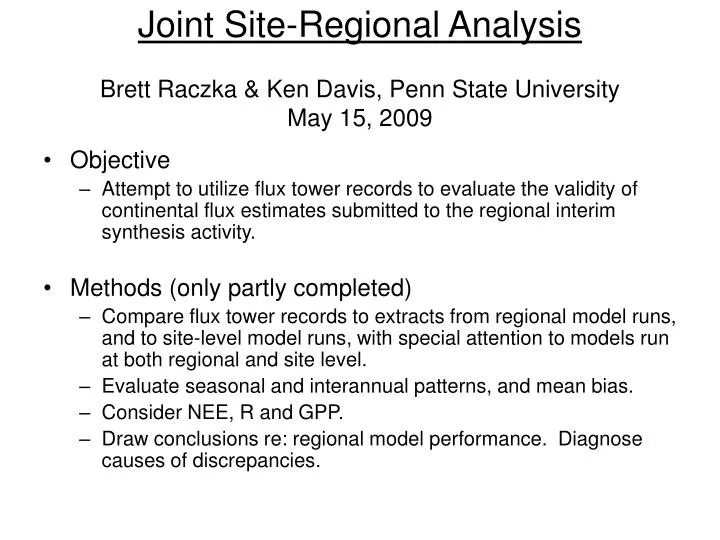
Joint Site-Regional Analysis Brett Raczka & Ken Davis, Penn State University May 15, 2009. Objective Attempt to utilize flux tower records to evaluate the validity of continental flux estimates submitted to the regional interim synthesis activity. Methods (only partly completed)

E N D
Joint Site-Regional Analysis Brett Raczka & Ken Davis, Penn State UniversityMay 15, 2009 • Objective • Attempt to utilize flux tower records to evaluate the validity of continental flux estimates submitted to the regional interim synthesis activity. • Methods (only partly completed) • Compare flux tower records to extracts from regional model runs, and to site-level model runs, with special attention to models run at both regional and site level. • Evaluate seasonal and interannual patterns, and mean bias. • Consider NEE, R and GPP. • Draw conclusions re: regional model performance. Diagnose causes of discrepancies.
Joint Site-Regional Analysis • Conclusions to date: • Regional model NEE output presents a systematic positive bias as compared to site level runs • Site level model runs produce higher annual NEE variability (sigma) than regional runs, more representative of observed annual NEE • Site level annual NEE produce higher correlation (R) to observed annual NEE than regional model runs • CLM-CN, CLM-CASA, CASA-GFED consistently ranked highest among model skill statistics for regional runs • ECOSYS, CanIBIS consistently ranked highest “ “ for site level runs Brett Raczka & Ken Davis, Penn State University
Future work: Joint Site-Regional Analysis • Add additional sites and models (cutoff date?) • Take comments from community and modify analyses • Enlist help from the I-synthesis community in understanding the causes of observed model behaviors • Expand analyses to the seasonal cycle, and R and GPP • Publish results • Possibly contribute some portion of the site analyses to site-only papers. Brett Raczka & Ken Davis, Penn State University
Interim Synthesis: Inter-annual NEE Carbon Source • Point #1: Systematic difference between site and regional extract model runs (DLEM, ORCHIDEE & SIB were only models run in both modes) • Regional model runs for DLEM & ORCHIDEE present a consistent positive bias compared to site model runs for DLEM & ORCHIDEE • Source(s) of Annual NEE difference? - Different driver (met) data - Different site characteristics (soil or vegetation) - Equilibrium?, Regional model averaging Carbon Sink Carbon Source Carbon Sink Brett Raczka & Ken Davis, Penn State University
Interim Synthesis: Inter-annual NEE Regional Model Run • Correlation Coefficient (R) Point #2: For regional model runs R has wide spread i.e. R values distributed across -1 to 1 across all sites and models (1st figure) Point #3: For site model runs R has considerable spread as well, but there are exceptions: Mer (Peatland) UMB (DBF) Me2 (Pond. Pine) –anticorrelated Obs (Old Black Spruce) (2nd Fig.) Site Model Run Brett Raczka & Ken Davis, Penn State University
Interim Synthesis: Inter-annual NEE Regional Model Run • σobservations vs. σmodel Point #4: For regional model runs, in general: σobs >>σmodel, eg: Let (Grass), Ca1 (ENF), Ne3 Corn/Soy (1st Figure) Point #5: For site model runs, in general: σobs ~σmodel (2nd Figure) Why? - Does regional averaging reduce variability either for NEE or driver data input? -Reminiscent of large variability for atmospheric inversions compared to forward model runs over continent Site Model Run Brett Raczka & Ken Davis, Penn State University
Interim Synthesis: Inter-annual NEE Regional Model Run • RMSD (centered pattern difference) Point #6: For regional model runs, no site-model combination that performed ‘well’ i.e. small RMSD. Inter-annual pattern not being captured (1st figure) Point #7: For site model runs, several sites show small RMSD, eg. UMB, Mer, Obs & Ho1. (2nd figure) Not consistent across PFT however. Site Model Run Brett Raczka & Ken Davis, Penn State University
Interim Synthesis: Inter-annual NEE Regional Model Runs • Overall Model Rankings Ranking Criteria: • Bias (Observed mean - model mean) • Total RMSD (Includes both bias and centered RMSD) • R (Correlation Coefficient) Two methods to rank: • Based on average statistic value across all sites • Based on average ranking value across all sites Regional Model Runs Brett Raczka & Ken Davis, Penn State University
Interim Synthesis: Inter-annual NEE Regional Model Runs Brett Raczka & Ken Davis, Penn State University
Interim Synthesis: Inter-annual NEE Site Model Runs Site Model Runs Brett Raczka & Ken Davis, Penn State University
Interim Synthesis: Inter-annual NEE Site Model Runs Brett Raczka & Ken Davis, Penn State University