Download
1 / 20
210 likes | 384 Views
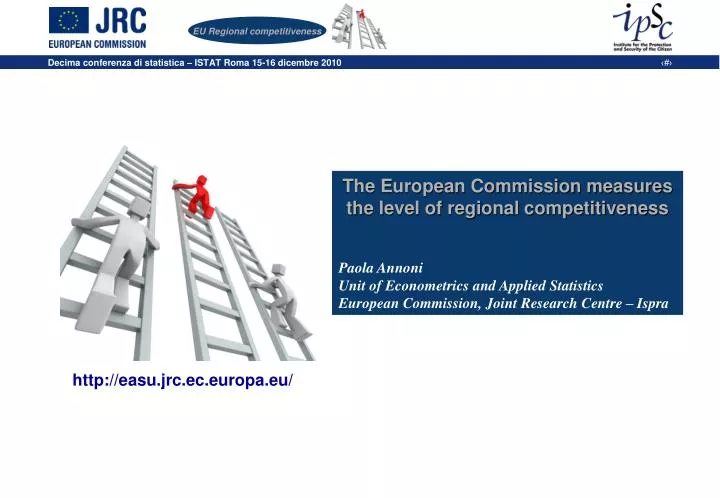
The European Commission measures the level of regional competitiveness Paola Annoni Unit of Econometrics and Applied Statistics European Commission, Joint Research Centre – Ispra . http://easu.jrc.ec.europa.eu/. Joint project between DG JRC (Ispra) and DG Regional Policy (Brussels)

E N D
The European Commission measures the level of regional competitiveness Paola Annoni Unit of Econometrics and Applied Statistics European Commission, Joint Research Centre – Ispra http://easu.jrc.ec.europa.eu/
Joint project between DG JRC (Ispra) and DG Regional Policy (Brussels) Measures the ‘level of competitiveness’ of EU regions at the NUT2 geographical level RCI 2010 released in September 2010 and will be updated every 2 years
Territorial competitiveness, what are you? The concept is still controversial among the experts Stands between micro (firm) and macro (country) competitiveness …. many analogies BUT with key differences: unsuccessful firms can be expunged from business, underperforming countries cannot competitions among firms is a zero-sum game (mors tua vita mea), the success of one country is generally positive for surrounding ones (spillover effects)
Territorial competitiveness, what are you? Meyer-Stamer*, 2008, pg.7: “We can define (systemic) competitiveness of a territory as the ability of a locality or region to generate high and rising incomes and improve livelihoods of the people living there” Social and human aspects play a key role * Meyer-Stamer, Jörg, late German Political Scientist
The RCI framework Three macro dimensions Basic Efficiency Innovation Data sources: Eurostat OECD-PISA - OECD-Regional Patent Database European Cluster Observatory World Bank Governance Indicators Ease of Doing Business Flash Eurobarometer 11 pillars 69 indicators (out of 81 candidates)
Basic Pillars • Nordic countries score high • Macro economic stability low in the south • Governance and corruption problematic both east and south
Efficiency Pillars • Capital regions consistently score higher than surrounding regions • Northwest scores best • Southeast scores low
Innovation Pillars • Scores are high in the Nordic countries, Benelux, Germany and France • Portugal and Southeastern EU score low
Steps of the analysis: Assessment of data quality, consistency and adequacy to the final goal (statistical analysis) Data transformation and normalization Data aggregation with different weights to different groups of pillars Robustness analysis
Three classes: MEDIUM : <75% of EU GDP 2007 (PPP per head) INTERMEDIATE: between 75% and 100% HIGH: >100% Weights adjusted according to the level of development of the region(built on WEF-GCI) It’s the threshold defined by EU Commission for eligibility for the ‘Convergence’ objective
RCI 2010 Warsaw Prague Paris Bratislava Budapest Madrid Bucharest Lisboa Rhône-Alpes Sofia Vienna Athens
A focus on the Italian situation Source: 21.09.2010 REGIONI D'EUROPA: CHI É PIÙ COMPETITIVO? Paola Annoni , Kornelia Kozovska e Andrea Saltelli Lavoce.info – www.lavoce.info
A focus on the Italian situation – basic pillars RCI 65.3 RCI 35.8 RCI 58.5 RCI 27.7C
A focus on the Italian situation – efficiency pillars RCI 65.3 RCI 35.8 RCI 58.5 RCI 27.7C
A focus on the Italian situation – innovation pillars RCI 65.3 RCI 35.8 RCI 58.5 RCI 27.7C
Relation with exogenous variables Further analysis (about to be published): Spatial autocorrelation analysis