Download
1 / 1
10 likes | 187 Views
ASSOCIATIONS: Earth System Grid, Community Data Portal, CEDAR, NSF/NMI SPONSORS: National Science Foundation/CISE/Shared Cyberinfrastructure Initiative FURTHER READING: http://vsto.hao.ucar.edu/ and watch for http://www.vsto.org.

E N D
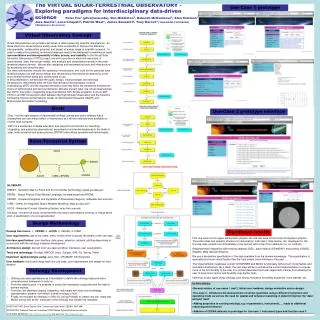
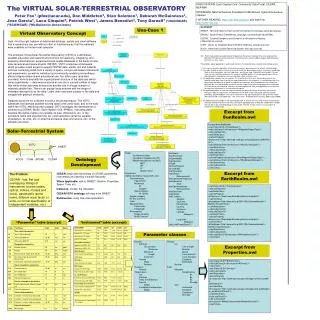
ASSOCIATIONS: Earth System Grid, Community Data Portal, CEDAR, NSF/NMI SPONSORS: National Science Foundation/CISE/Shared Cyberinfrastructure Initiative FURTHER READING: http://vsto.hao.ucar.edu/ and watch for http://www.vsto.org The VIRTUAL SOLAR-TERRESTRIAL OBSERVATORYPeter Fox1 (pfox@ucar.edu), Don Middleton2, Stan Solomon1, Deborah McGuinness3, Jose Garcia1, Luca Cinquini2, Patrick West1, James Benedict3, Tony Darnell1 (1HAO/NCAR) (2SCD/NCAR) (3McGuinness Associates) GLOSSARY: SWEET - Semantic Web for Earth and Environmental Terminology, sweet.jpl.nasa.gov SPDML - Space Physics Data Markup Language, sd-www.jhuapl.edu/SPDML CEDAR - Coupled Energetics and Dynamics of Atmospheric Regions, cedarweb.hao.ucar.edu CISM - Center for Integrated Space-Weather Modeling, www.bu.edu/cism ACOS - Advanced Coronal Observing System, mlso.hao.ucar.edu Use-Case 1 Virtual Observatory Concept Goal - find the right balance of data/model holdings, portals and client software that a researchers can use without effort or interference as if all the materials were available on his/her local computer. The prototype Virtual Solar-Terrestrial Observatory (VSTO) is a distributed, scalable education and research environment for searching, integrating, and analyzing observational, experimental and model databases in the fields of solar, solar-terrestrial and space physics (SSTSP). VSTO comprises a framework which provides virtual access to specific SSTSP data, model, tool and material archives containing items from a variety of space- and ground-based instruments and experiments, as well as individual and community modeling and software efforts bridging research and educational use. Too often users (and data providers) have to deal with the organizational structure of the data sets which varies significantly --- data may be stored at one site in a small number of large files while similar data may be stored at another site in a large number of relatively smaller files. There is an equally large problem with the range of metadata descriptions for the data. Users often only want subsets of the data and struggle with getting it efficiently. Datasets alone are not sufficient to build a virtual observatory. The VSTO addresses the interface problem to bring data to the users' tools, and to the tools within the VSTO, effectively and scalably. VSTO leverages the development of schema (e.g CEDAR, MLSO, Earth System Grid, SPMDL) that adequately describe the syntax (name of a variable, its type, dimensions, etc. or the procedure name and argument list, etc.) and semantics (what the variable physically is, its units, etc. or what the procedure does and returns, etc.) of the datasets and tools. UC1: Plot the observed/measured Neutral Temperature (Parameter) looking in the vertical direction for Millstone Hill Fabry-Perot interferometer (Instrument) from January 2000 to August 2000 (Temporal Domain) as a time series . Precondition: portal application is authorized to access the backend data extraction and plotting service 1. User signs in to portal application (or otherwise accesses application with or without authenticating) 2. User goes through a series of views to select (in order) the desired observatory, instrument, record-type (kind of data), parameter, start and stop dates, and the plot type (should this be inferred?). At each step, the user selection determines the range of available options in the subsequent steps. NB, an alternate path is selection of start and stop dates, then instrument, etc. 3. The application validates the user request: first it verifies that the user is authorized to access the specific kind of data, then it verifies the logical correctness of the request, i.e. that Millstone Hill is an observatory that operates a type of instrument that measures neutral temperature (i.e. check that Millstone Hill <isA> observatory and check that the range of the measures property on the Millstone Hill Fabry Perot Interferometer subsumes neutral temperature). Also, the application must verify that no necessary information is missing from the request. 4. The application processes the user request to locate the physical storage of the data, returning for example a URL-like expression: find Millstone Hill FPI data of the correct type (operating mode; defined by CEDAR KINDAT since the instrument has two operating modes) in the given time range (Millstone Hill FPI <hasKindofData> 1701 <intersects> TemporalDomain [January 2000, August 2000] ) 5. The application plots the data in the specified plot type (a time series). This step involves extracting the data from records of one or more files, creating an aggregate array of data with independent variable time (of day or day+time depending on time range selected) and passing this to a procedure to create the resulting image. Excerpt from SunRealm.owl Excerpt from SunRealm: <owl:Class rdf:ID="ActiveRegion"> <rdfs:subClassOf rdf:resource="#MagneticRegionType"/> <rdfs:subClassOf> <owl:Restriction> <owl:onProperty rdf:resource="http://sweet.jpl.nasa.gov/ontology/space.owl#isPartOf"/> <owl:allValuesFrom rdf:resource="#SunSurfaceLayer"/> </owl:Restriction> </rdfs:subClassOf> <rdfs:subClassOf> <owl:Restriction> <owl:onProperty rdf:resource="#hasMagneticRegionType"/> <owl:allValuesFrom rdf:resource="#SunMagneticRegion"/> </owl:Restriction> </rdfs:subClassOf> </owl:Class> Instrument classes Solar-Terrestrial System VSTO SWEET Radar Incoherent Scatter Ionospheric Doppler(aka HF) Middle Atmosphere (aka MLT) MST MF LF Meteor Wind Digisondes Optical (hasBand, measuresTo, etc.) Interferometers Fabry-Perot Michelson IR Doppler Spectrometers IR ([OH]) Airglow Imagers All-Sky Cameras Lidar Spectrometers Polarimeter Heliograph Photometers Single-Channel Multi-Channel hasName: alsoKnownAs: isOperatedBy: hasOperator: isType: isPartofProgram: isFundedBy: hasCoverage: hasSensor: Measurement: hasOperatingFrequency: hasOperation: Start: hasOperatingMode: Measurement: hasDataFrom: hasDataTo: hasLocation: Address: CityTown: PostalCode: Country: Continent: Latitude: Magnetic: Longitude: Magnetic: hasLocalTimeatZeroUT: Ontology Development ACOS CISM +SPDML CEDAR Excerpt from EarthRealm.owl CEDAR: begin with flat listings of CEDAR parameters, instruments and develop a simple hierarchy Where applicable: add to SWEET; Realms, Properties, Space, Time, etc. Instances: contain the metadata CEDAR/VSTO ontology: will map from SWEET Build/evolve: using Use-case application The Problem: CEDAR - has ‘flat’ and overlapping listings of instruments (covers radars, optical, indices, models and more), parameters (same name, different scale factor or units, no formal specification of independent variables, etc.) <owl:Class rdf:ID="Thermosphere"> <rdfs:subClassOf> <owl:Restriction> <owl:onProperty rdf:resource="#hasLowerBoundaryReferenceHeight"/> <owl:hasValue rdf:datatype="http://www.w3.org/2001/XMLSchema#double"> 85000</owl:hasValue> </owl:Restriction> </rdfs:subClassOf> <rdfs:subClassOf> <owl:Restriction> <owl:onProperty rdf:resource="#hasUpperBoundaryReferenceHeight"/> <owl:hasValue rdf:datatype="http://www.w3.org/2001/XMLSchema#double"> 500000</owl:hasValue> </owl:Restriction> </rdfs:subClassOf> <rdfs:subClassOf rdf:resource="#AtmosphereLayer"/> </owl:Class> “Parameter” table (excerpt) “Instrument” table (excerpt) Parameter classes Density Electron Uncorrected Maximum Maximum Height Increment Neutral Mass Number Pressure Neutral Temperature Ion Electron Ratio (Ion/Electron) Neutral Model Exospheric temperature Model Velocity Ion Line of sight Bisector Sprea Local azimuth Local elevation Eastward Northward Neutral Field Magnetic Interplanetary Bx By Bz Strength Geo Northward Eastward Downward Strength Excerpt from Properties.owl <owl:Class rdf:ID="BulkDensity"> <rdfs:subClassOf rdf:resource="#Density"/> </owl:Class> <owl:Class rdf:ID="Density"> <rdfs:subClassOf> <owl:Restriction> <owl:onProperty rdf:resource="http://sweet.jpl.nasa.gov/ontology/numerics.owl#ha sDefaultUnit"/> <owl:hasValue rdf:resource="http://sweet.jpl.nasa.gov/ontology/units.owl#kilogra m_perMeterToPover3"/> </owl:Restriction> </rdfs:subClassOf> <rdfs:subClassOf rdf:resource="#MassConcentrationRelatedQuantity"/> </owl:Class>