Download
1 / 33
330 likes | 480 Views
ANACOSTIA RESTORATION. Indicators: How They Are Helping Achieve Water Quality Goals?. SWRR April 2006 Meeting Ted Graham, Metropolitan Washington Council of Governments. Indicators and Water Quality Goals. Restoration of the Anacostia Watershed Water quality Habitat Stewardship

E N D
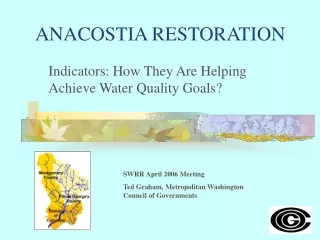
ANACOSTIA RESTORATION Indicators: How They Are Helping Achieve Water Quality Goals? SWRR April 2006 Meeting Ted Graham, Metropolitan Washington Council of Governments
Indicators and Water Quality Goals • Restoration of the Anacostia Watershed • Water quality • Habitat • Stewardship • Institutional Framework for Restoration • Setting for Indicators & Targets • Indicators and Targets: How are They Helping? • Keeping score • Setting program targets • Communicating progress • Incentive? SWRR April 2006 Meeting
The Anacostia Watershed Size (square miles): District of Columbia 30 (17%) Prince George’s 86 (49%) Montgomery 60 (34%) TOTAL 176 (100%) 0.3% of the Chesapeake Bay watershed area (64,000 sq. mi.) Population: District of Columbia 292,811 (36%) Prince George’s 311,573 (39%) Montgomery 200,073 (25%) TOTAL 804,457 (100%) 5.7% of the Chesapeake Bay watershed population (14,000,000)
Crew Team Preparing for Practice at Anacostia Waterfront Park Canoeing the ‘Kingfisher Trail’ on the Tidal Anacostia River Campers at Greenbelt National Park Springtime on the Northwest Branch SWRR April 2006 Meeting
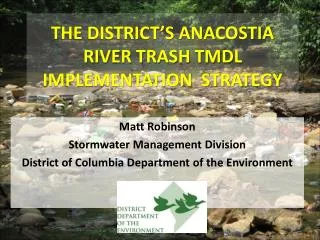
Priority Problems • Fecal bacteria • Low oxygen levels • Sediment • Toxics • Trash • Degraded habitat SWRR April 2006 Meeting
Surface Pollutants Sewage Erosion CSOs Stormwater SOURCES CARRIERS POOR WATER QUALITY RESULTS
Restoration by Regulation • CSO Long-Term Control Plan • DC-WASA (2001) • Municipal Stormwater Permits (Beginning in 1990s) • DC-WASA, DOH & DPW • Prince George's County • Montgomery County SWRR April 2006 Meeting
Restoration by Cooperation • Regional cooperation since 1987 • 1987, 1991 & 1999 Agreements • Local, state, federal partnership • Common commitment to I&T SWRR April 2006 Meeting
Agreements • Agreement to Cooperate (1987) • Six Point Action Plan (1991) • Goal 1 – Improve water quality • Goal 2 - Restore & protect ecological integrity • Goal 3 - Restore natural range of fish • Goal 4 - Increase wetlands • Goal 5 - Expand forest cover & riparian buffer • Goal 6 - Increase public awareness and participation • Indicators and Targets (1999, 2001) • Define indicators tied to the six goals • Set targets to be achieved by 2010 • Reconvene biennially to assess progress SWRR April 2006 Meeting
I&T Expectations • Encourage watershed-based planning • Foster regional cooperation • Develop public involvement and support • Help set program & budget priorities • Engage elected officials SWRR April 2006 Meeting
Indicators & Targets • Indicators • 50 selected from over 100 candidates • Each measures a distinct aspect, e.g.: • “Inputs” - Stream Miles Restored • Tied to management actions • “Outputs” - Dissolved Oxygen • Tied to expected outcomes • 2010 targets selected for each of the 50 indicators SWRR April 2006 Meeting
Goal 1 – Reduce Pollutant Loads • Ten Indicators, including: • Total suspended solids (sediment) • Combined sewer overflows • Fecal coliform contamination • Dissolved oxygen • Trash index • Toxics and metals • Example • Dissolved Oxygen • 2001 Baseline - 75% of the time less than 5 mg/L • 2010 Target - 10% of the time less than 5 mg/L SWRR April 2006 Meeting
Low Dissolved Oxygen Mean DO Concentrations at Seafarer's Marina Station 8 7 6 5 DO Concentration (mg/l) 4 3 2 1 0 2010 Projected 1990 1994 1999 2010 Year Distinct improvement since 1990 Still many periods below standards
Urban Development Washington D.C. Sediment Potomac River Anacostia River SWRR April 2006 Meeting
Toxics • 1992 Sediment Study: • Metals • Lead • Mercury • Zinc • Cadmium • Organics • DDT • Chlordane • PCBs SWRR April 2006 Meeting
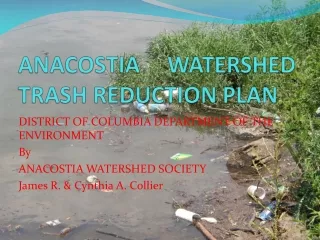
Sligo Creek Watershed Trash Trash problems are widespread and require constant attention. SWRR April 2006 Meeting
Robert Boone, Anacostia Watershed Society 4,000 tires dumped in the Anacostia River drainage SWRR April 2006 Meeting
Goal 2 – Ecological Integrity • 11 indicators, including: • Temperature • Macroinvertebrate community health • Resident fish community health • Stream miles restored • Example: Stream Miles Restored • 2001 Baseline: about 15 miles since 1987 • Target: 20 additional miles by 2010 SWRR April 2006 Meeting
Stream Restoration To repair degraded stream habitat Devastation - 1990 Restoration - 1992 Natural Healing - 1999 Restoration on Wheaton Branch of Sligo Creek SWRR April 2006 Meeting
Little Paint Branch Stream Restoration SWRR April 2006 Meeting
Goal 3 – Fish Passage • Three indicators, including: • Percent anadromous fish range open • Percent anadromous fish habitat utilization • Example: Percent historic spawning range open • 2001 Baseline: about 15 miles open • Target: 20 additional miles SWRR April 2006 Meeting
Goal 4 – Wetland Acreage • Three indicators, including: • Created/restored tidal wetland acreage • Created/restored non-tidal wetland acreage • Example: Restored Tidal Wetland Acreage • 2001 Baseline: about 75 acres created since 1987 • Target: create an additional 60 acres SWRR April 2006 Meeting
Kenilworth Marsh in D.C. After Restoration SWRR April 2006 Meeting
Goal 5 – Forest Cover • Five indicators, including: • Miles of created riparian forest • Acres of created upland forest • Example: Miles of Created Riparian Forest • 2010 Baseline: about~12 miles created since 1987 • Target: create an additional 112 miles SWRR April 2006 Meeting
One of Many Anacostia Tree Planting Events Earth Conservation Corps Volunteers on Buzzard Point SWRR April 2006 Meeting
Goal 6 – Public Involvement • Eighteen indicators in three categories: • Use • Stewardship • Advocacy • Example: Active Subwatershed “Friend of” Groups • 2010 Baseline: six active • Target: fourteen, covering all subwatersheds SWRR April 2006 Meeting
Volunteer Tree Planting Gum Springs – Fall 2000 SWRR April 2006 Meeting
I&T Accomplishments • Promoted interagency coordination • Stimulated public awareness • Systematic program for monitoring, tracking & reporting • 50 indicators • 2010 targets for each indicator • Basis for 2001 signing ceremony • Framework for reporting progress & continuing need SWRR April 2006 Meeting
Restoration Indicators and Targets ‘Report Card’ (2002-2010) SWRR April 2006 Meeting
Not a Panacea • Biennial meetings have not occurred • Incentives and pressures are indispensable • Grants • Consent orders • Permit conditions SWRR April 2006 Meeting
Contact Information Ted Graham WashCOG (202) 962-3352 tgraham@mwcog.org SWRR April 2006 Meeting