Download
1 / 22
220 likes | 381 Views
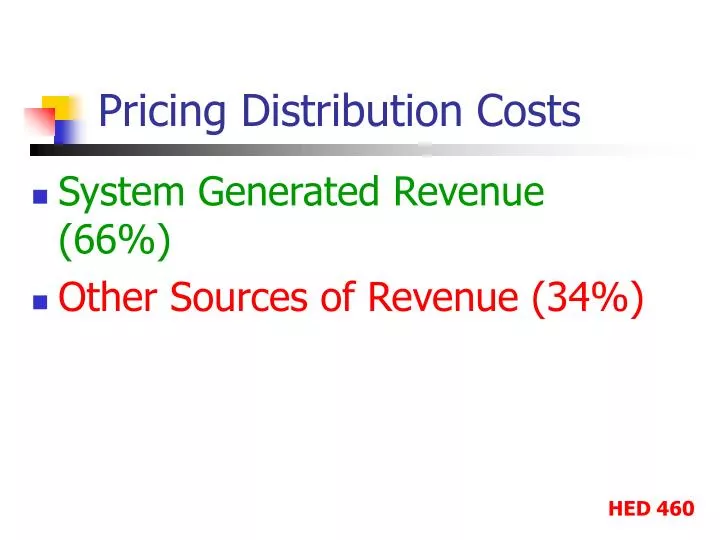
Pricing Distribution Costs. System Generated Revenue (66%) Other Sources of Revenue (34%). System Generated (66%). Markups (68% of the 66%) Must cover costs and contribute to profit Activity Based Costing (ABC). Activity Based Costing. Alternative way to allocate overhead

E N D
Pricing Distribution Costs • System Generated Revenue (66%) • Other Sources of Revenue (34%) HED 460
System Generated (66%) • Markups (68% of the 66%) • Must cover costs and contribute to profit • Activity Based Costing (ABC) HED 460
Activity Based Costing • Alternative way to allocate overhead • Formerly labor costs were highest costs • Now, materials costs are highest • Tries to turn indirect costs into direct costs HED 460
Activity Based Costing • Attaches costs to products and services based on activities performed to produce, distribute, support those products/services HED 460
Activity Based Costing • Activities • Acquisition • Handling • Storage • Delivery • More complex than cost accounting but benefits are worth it HED 460
System Generated (66%) • Cash discounts (27%) • Reduction to price for early payment • Backhaul revenue (5%) • Avoids truck returning empty after delivery • Pick up merchandise at a manufacturer on the way back to DC HED 460
Other Sources (34%) • Inside Margin (revenue generated by some activity other than distributing products • Forward buying (44% of the 34%) • Buy more than needed at discount price • Diverting (9%) • Buy product on “deal” in one region and resell at profit in another HED 460
Other Sources (34%) • Inside Margin • Promo money (35%) • Offered by manufacturer - not passed to retailer • Slotting allowances (12%) • Payment for space on retail shelves • Salvage (<1%) HED 460
System Generated (66%) • Markups (68%) • Cash Discounts (27%) • Backhaul Revenue (5%) HED 460
Other Sources (34%) • Inside Margin • Forward Buying (44%) • Promo money (35%) • Slotting allowances (12%) • Diverting (9%) • Salvage (<1%) HED 460
Cross Docking (ECR initiative) • Sending goods directly to the retailer by bypassing storage • Benefits • Reduces distribution costs • Storing, picking • Improves efficiency • >inventory turn, < carrying costs, faster flow to customers HED 460
Cross Docking Products • Short replenishment lead times • Strong demand • Predictable volume • Cases on pallets HED 460
Cross Docking Requirements • Partner with supply chain members • Confidence in product quality and availability • Technology • Personnel, equipment, facilities HED 460
Cross Docking - ASN’s • Electronic bill of lading (invoice) • Eliminates retailers opening cartons and inventorying • 85-95% department store merchandise comes with ASN • Helps plan staff to help with unpacking HED 460
Cross Docking • 15-30% products are now cross-docked • Save 5-20% in handling costs • U.S. is behind Europe • Tesco and Sainsbury even cross dock fresh foods HED 460
In Class #5 • View video tape • Discuss terms from reading or video that are still confusing • What are three key “learnings” from the video? • Group members’ names HED 460
Direct Store Delivery • Back door traffic at store • 25% of grocery products never see a warehouse HED 460
DSD Product Characteristics • Shelf life • Bread/pastry/salty snacks/beer • 30-70 days DSD vs 390 days for warehoused category • Higher SKU velocity • 12 units/store/week vs 9 units HED 460
DSD Product Characteristics • Demand variability • Frequent promotions • Frequent service • Lower value density • Fragility - chips • Weight – beer, soft drinks HED 460
DSD Product Characteristics • Lower value density (cont.) • $27/cu. Ft. (dsd) vs $100/cu. Ft. • Price divided by space • High cost as a % sales • Merchandising difficulty • Special equipment HED 460
Problem • How can you have a low GM but high profit and sales? • COGS must be high • Expenses must be minimized • Emphasis on contribution margin HED 460
Direct Store Delivery Results • More cash flow • 8 days of inventory held with 30 day payment • Turns • Contribution Dollars • GMROI • High % of in-stock HED 460