Download
1 / 29
290 likes | 293 Views
Figures from Chapter 2, Forecasting Global Warming, by Austin P. Hope, Timothy P. Canty, Ross J. Salawitch, Walter R. Tribett and Brian F. Bennett, in Paris Climate Agreement: Beacon of Hope. Use of these figures is permitted under the terms of the Creative Commons Attribution 4.0

E N D
Figures from Chapter 2, Forecasting Global Warming, by Austin P. Hope, Timothy P. Canty, Ross J. Salawitch, Walter R. Tribett and Brian F. Bennett, in Paris Climate Agreement: Beacon of Hope. Use of these figures is permitted under the terms of the Creative Commons Attribution 4.0 International License (http://creativecommons.org/licenses/by/4.0/), which permits use, duplication, adaptation, distribution and reproduction in any medium or format, as long as appropriate credit to the original authors is given. Any use of these figures in a publication should cited them as: Hope, A.P. et al., Chapter 2, Forecasting Global Warming, in Salawitch, R.J., T.P. Canty, A.P. Hope, W.R. Tribett, and B.F. Bennett, Paris Climate Agreement: Beacon of Hope, doi 10.1007/978-3-319-46939-3_2, 2017. The posting of any of these figures on the web is allowed, provided a citation and a link to http://parisbeaconofhope.org is included. Please consult the published document for full figure captions.
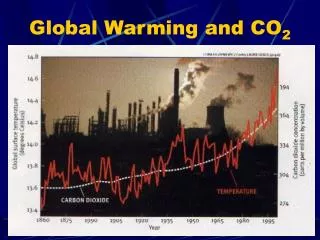
Figure 2.4 Observed and EM-GC simulated global warming, 1860-2015, for a model that considers effects on climate of humans, solar output, volcanic eruptions, and the El Niño Southern Oscillation (ENSO)
Figure 2.5 Observed and EM-GC simulated global warming, for a model that considers effects on climate of factors considered in Fig. 2.4 plus variability in the Atlantic Meridional Overturning Circulation (AMOC), the Pacific Decadal Oscillation (PDO), and the Indian Ocean Dipole (IOD)
Figure 2.6 Aerosol ΔRF versus time, for six components of the RF due to aerosols, for AerRF2011 = 0.9 W m2 (), based on RCP 4.5 aerosol precursor emissions
Figure 2.7 Aerosol ΔRF versus time, RCP 4.5 and 8.5 aerosol precursor emissions, for AerRF2011of 0.1, 0.4, 0.9, 1.5, and 1.9 W m2
Figure 2.8 Ocean Heat Content (OHC) versus time from six sources, plus the average of the six measurements (black solid)
Figure 2.9 Observed and EM-GC simulated global warming, 18602015, as well as global warming projected to 2060, for AerRF2011 of 0.4 (a), 0.9 (b), 1.5 (c) W m2
Figure 2.10 Observed and EM-GC simulated global warming, 18602015, as well as global warming projected to 2060, for AerRF2011 = 0.9 W m2 and Ocean Heat Content (OHC) as reported by Ishii and Kimoto (2009) (a), Levitus et al. (2012) (b), and Gouretski and Reseghetti (2010) (c)
Figure 2.11 Equilibrium Climate Sensitivity from the literature and the EM-GC simulations
Figure 2.12 Sensitivity of Attributable Anthropogenic Warming Rate (AAWR) to ΔRF of aerosols
Figure 2.13 Attributable Anthropogenic Warming Rate (AAWR) from the EM-GC and CMIP5 GCMs
Figure 2.14 Observed and EM-GC simulated ΔT, 19952016, along with linear fits to the modeled and measured ΔT for time period from the start of 1998 to the end of 2012, the time of the so-called hiatus in global warming
Figure 2.15 Projected rise in Global Mean Surface Temperature in year 2060 (ΔT2060) as a function of climate feedback and aerosol radiative forcing
Figure 2.16 Projected rise in Global Mean Surface Temperature in year 2100 (ΔT2100) as a function of climate feedback and aerosol radiative forcing
Figure 2.17 Probability distribution functions of rise in global mean surface temperature in year 2060 (ΔT2060) from the EM-GC and from CMIP5 GCMs
Figure 2.18 Probability distribution functions of rise in global mean surface temperature in year 2100 (ΔT2100) from the EM-GC and from CMIP5 GCMs
Figure 2.19 Projections of global mean surface temperature relative to a pre-industrial baseline (ΔT) for RCP4.5 emissions, from EM-GC (color bar) and CMIP5 GCMs (grey lines); the likely range for ΔT given in Chapter 11 of IPCC (2013) (green) and the Paris target and upper limits of warming (gold) are also shown
Figure 2.20 Projections of global mean surface temperature relative to a pre-industrial baseline (ΔT) for RCP8.5 emissions, from EM-GC (color bar) and CMIP5 GCMs (grey lines); the likely range for ΔT given in Chapter 11 of IPCC (2013) (green) and the Paris target and upper limits of warming (gold) are also shown
Table 2.1 Cumulative probability the rise in ΔT remains below a specific value, 2060 and 2100
Table 2.3, AAWR from GCM RCP 4.5 simulations in the CMIP5 archive
Table 2.3, continued AAWR from GCM RCP 4.5 simulations in the CMIP5 archive
Table 2.3, continued AAWR from GCM RCP 4.5 simulations in the CMIP5 archive
Table 2.3, continued AAWR from GCM RCP 4.5 simulations in the CMIP5 archive
Table 2.3, continued AAWR from GCM RCP 4.5 simulations in the CMIP5 archive