Download
1 / 43
430 likes | 570 Views
Education Status. Arkansas and the Northwest Region. AR Education Reports Policy Briefs Report Cards Newsletters Data Resources. OEP is a research center within the College of Education and Health Professions at the University of Arkansas that specializes in

E N D
Education Status Arkansas and the Northwest Region
AR Education Reports • Policy Briefs • Report Cards • Newsletters • Data Resources OEP is a research center within the College of Education and Health Professions at the University of Arkansas that specializes in Education Research and Policy. www.uark.edu/ua/oep
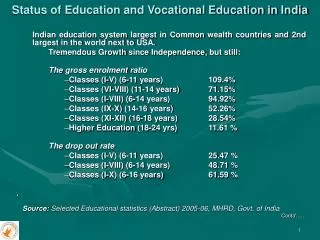
Overview Arkansas • State Strengths: 2011 Quality Counts Report • Assessment Success: NAEP Standardized Testing • Achievement Gaps: Demographics, FRL Northwest Region • The “Big 5” Districts • Assessment Success: Benchmark Standardized Testing • Achievement Gaps: Demographics, FRL • Regional Features: Postsecondary Schooling and Expenditures
Quality Counts: 2011 Report • State Strengths • AR ranks 6th nationally with an overall grade of B-(81.4) • Overall grade is higher than the national average of C+(76.3) and • greater than the surrounding states average of C- to C+ • AR received an A (94.4%) on the Standards, Assessments, and • Accountability category regarding educational policy measures • AR earned a B+ in the teaching Profession and ranks 2nd nationally *The overall EdWeek ranking system is subject to criticism
State Demographics *Other includes Asian, 2 or more races, Native Alaskan, Native American, Native Hawaiian and Pacific Islander
Hispanic students LEP/ELL Students are in appropriate programs of language assistance (e.g., English as a Second Language, High Intensity Language Training, bilingual education). • The state’s enrollment for Hispanic students is • below the national average • The state’s enrollment for LEP/ELL students • is below the national average *2009 Data *CCD Common Core of Data, US Department of Education, State Profiles
Standardized Testing: NAEP • National Assessment for Educational Progress • Also known as “The Nation’s Report Card” • The largest nationwide assessment of what students know in various • academic subjects • Exams are administered and collected uniformly across the nation; • allowing for comparison of national, state and long term academic • progress, including trends over time Recent NAEP results show that ELL students, English Language Learners, performed at a level 3% higher in NWA than ELL students nationally!
NAEP Mathematics Grade 4: National Math Scores • AR continues to • fall just below the • national average • AR saw a slight • decrease in the • percentage of • proficient and • advanced scores • Similar in Gr 8
NAEP Reading Grade 8: National Reading Scores • Both the Nation • and State are • seeing rising • reading scores • AR continues • to show scores • just below the • national average • Similar in Gr 4
Achievement Gaps There are a variety of reasons for achievement gaps in AR but the disadvantages for low-income and minority students cannot be ignored. AR policy makers are focused on improving educational outcomes for all children, regardless of their income, race or geographic location. • Areas of Concern • Racial Gap between majority and minority students • Measured by NAEP performance for White, Black and Hispanic students • Poverty Gap between students eligible for FRL and students not eligible • Measured by NAEP performance for students eligible and not eligible for FRL *FRL = Free and Reduced Lunch
Racial Achievement Gap NAEP: Grade 4 Math NAEP: Grade 8 Math *The racial achievement gap between Arkansas students continues to widen
Poverty Achievement Gap: NAEP Performance NAEP: Grade 4 Math NAEP: Grade 8 Math *The poverty achievement gap between is growing as scores for disadvantaged students remain flat while scores for their more affluent peers are improving a bit
Achievement Gaps – 2009 AR v. US NAEP: Grade 4 Math NAEP: Grade 4 Math • Hispanic Students • outperformed • their peers across the • country on the same exam • AR poverty students and • non-poverty students • outperformed national • peers on the same exam A bit of good news!
Remediation Rates • A remedial student is a first-time entering student who does not meet the board’s cut-off • score (on ACT, SAT, Compass and ASSET tests); and is being assigned to developmental-level • academic coursework. • 2010 AR Remediation rate is 52.5% • Full time students have substantially lower remediation rates • The Remediation rate for math, English and reading have decreased 2010 Fall Term Anytime Remediation Rates by Race/Ethnicity This report focuses on “anytime” remediation rates, in which the high school graduation date is ignored *Percentages may be rounded
State Recap • Positive news from the 2011 Quality Counts Report, which gave • AR a B- and a ranking of 6th nationally • AR students continue to fall just below the national average on • NAEP standardized testing • The achievement gaps, both racial and poverty, between AR • students continue to widen • AR poverty, non-poverty and Hispanic students outperformed • their US peers on the same exam
Northwest Arkansas There are fifteen different school districts that make up the NWA region. The focal point for this report are the “Big 5” districts, considering the attendance is the majority of NWA students. • The “Big 5” Districts • Bentonville • Fayetteville • Rogers • Siloam Springs • Springdale *Other NWA districts include Decatur, Elkins, Farmington, Gentry, Gravette, Greenland, Lincoln, Pea Ridge, Prairie Grove, and West Fork.
The “Big 5” Districts of NWA • In 2010, NWA students • made up 15% of all • Arkansas students • In 2004, NWA students • made up 13% Of all • Arkansas students * The ADE reports the 2010 NWA total enrollment: 72,826 students *Other NWA districts include Decatur, Elkins, Farmington, Gentry, Gravette, Greenland, Lincoln, Pea Ridge, Prairie Grove, and West Fork.
NWA Diversity • Rogers school district • shows the highest • percentage of FRL • students • Springdale school district • shows the highest • percentage of Minority • students • AR and NWA show an • equal percentage of • minority students • (AR largest minority group: Black) • (NWA largest minority group: Hispanic) Minority and FRL students: 2009 NWA Districts • Percentages may be rounded
NWA Hispanic Students • Springdale has the largest • percentage of Hispanic • students, while • Bentonville has the • lowest *2010 Data *Arkansas Department of Education, enrollment per district *percentages may be rounded
Arkansas Benchmark Exams • Arkansas Comprehensive Testing, Assessment, and • Accountability Program (ACTAAP) • Known as the Benchmark exams, a program with high academic standards, • professional development, student assessment, and accountability on the • schools’ behalf. • The testing approach ensures that students are performing on grade level and • communicates to schools what students should know. Results benefit the • parent, educators and local policy makers. • The state wide program has two main initiatives. The Smart Start Initiative • focuses on grades K – 4 and The Smart Step Initiative which focuses on • grades 5– 8; and education for grades 9-12 regarding writing, reading and • mathematics.
Benchmark Test Scores AR Benchmark Literacy Exam: Elementary Average (Grades 3—5), 2009 AR Benchmark Math Exam: Middle School Average (Grades 6—8), 2009 NWA students, both Elementary and Middle School, outperform their state-wide peers
Achievement Gaps in NWA • Areas of Concern • Racial Gap between majority and minority students • Poverty Gap between students eligible for FRL and students not eligible Hispanic students in NWA and AR scored at similar levels, the average was the same in middle school math and elementary literacy Black students in NWA performed 8 to 21 percentage points higher than their peers across the state White students in NWA scored an average of 2 to 7 percentage points higher than their peers across the state *AR Benchmark Test Performance serves as the measurement for achievement gaps *2009 Data
Elem. Scores by Racial Group, NWA AR Benchmark Math Exam: Elementary Average (Grades 3—5), 2009 *If there were 10 or fewer students tested in a particular grade, the data were not included.
Middle Scores by Racial Group, NWA AR Benchmark Literacy Exam: Middle School Average (Grades 6—8), 2009 *If there were 10 or fewer students tested in a particular grade, the data were not included.
Elem Scores by Poverty Group, NWA AR Benchmark Literacy Exam: Average for Grades 3—5, 2009 NWA shows a slightly higher percentage of proficient and advanced scores overall FRL students in NWA outperform FRL students across the state
Middle Scores by Poverty Group, NWA AR Benchmark Literacy Exam: Average for Grades 6—8, 2009 NWA shows a higher percentage of proficient and advanced scores than AR FRL students in NWA outperform FRL students across the state
End-Of-Course Exams • EOC exams are administered by the ACTAAP (AR Benchmark) and used to • help evaluate the performance of high school students • EOC exams are aligned to the standards contained within the Arkansas • Mathematics and Science Curriculum Frameworks • EOC exams include Algebra I, Geometry, 11th grade Literacy, and Biology • NWA students outperform their state-wide peers on EOC exams *For this report, the areas of focus are Algebra 1 and 11th Grade Literacy
11TH Grade Literacy Exam • NWA students • show a higher • percentage of • proficient and • advanced • scores than AR • The Grade 11 Literacy examination includes items that are aligned to the English Language Arts • Curriculum Framework for Arkansas
Algebra 1 “High Stakes” Exam • A new state law was • passed in 2010 • requiring students to • pass the Algebra 1 EOC • exam to graduate high • school • This exam serves for • both state and federal • accountability, being • the State’s first ever • “High Stake” exam The students have more than one opportunity to pass the exam, both additional tries and remediation are offered
AP Placement Exam • AP, or Advanced Placement courses are offered to high school • students, providing preparation for college level courses • If three points or higher is scored on the nationally coordinated AP • placement exam students can earn college credits • AP courses are a collaborative effort between students, teachers • and educational institutions
2009 AP Placement Exam Results • NWA shows a higher percentage of passing exams • NWA represents almost 10% of all AP exams taken in AR • Fayetteville High School was named #1 in AP Scholars in Arkansas in 2008 NWA Big 5 State Number of AP exams taken 5,305 31,232 Percent scoring 3, 4, or 5 (passing) 51% 30%
Graduation Rates • The NWA Graduation • rate is 84%, eight • percentage points • higher than the state • average
ACT American College Testing • The ACT is a national college admissions exam that tests English, mathematics, • reading and science. This exam assures academic preparation needed for college • level courses • The test gives a comprehensive overview of educational assessments and is • a great resource for educators • Students are encouraged to take the test considering the benefits such as • career planning, unique interest inventory and further educational planning 2009 National Average 21.1 2009 State Average 20.6 2008 NWA Average 22.6
ACT Average Composite Scores DISTRICT SCORE Bentonville 23.1 Fayetteville 24.1 Rogers 22.3 Siloam Springs 22.0 Springdale 22.7 NWA 22.6 AR 20.6 US 21.1 • Each of the “Big 5” • Districts in NWA • have a higher ACT • average than AR • and the US *2009 Data
Remediation Rates: NWA Districts • A remedial student is a first-time entering student who does not meet the cut-off score and • is being assigned to developmental-level academic coursework. • Good news, NWA • school districts • show over 10% less • remediated • students • than the state • Fayetteville shows • the lowest percent • of remediated • students This report focuses on “anytime” remediation rates, in which the high school graduation date is ignored *Percentages may be rounded *2009 Data
Postsecondary Education High school graduates of NWA have a variety of postsecondary educational options. This report highlights the four major higher education institutions in the region. • UAF University of Arkansas, Fayetteville • Offers more than 200 study programs, 87 bachelor’s degree programs in • 74 fields of study • The Carnegie Foundation placed the UAF among the top 10 percent of • universities nationwide • NWACC Northwest Arkansas Community College, Bentonville • A public two year college that offers 5 transfer associate degree programs, • preparing students for a 4 year college • Provides to its service areas with a regional technology center in Fayetteville • and the Washington Co. Center in Springdale This report highlights the four major higher education institutions in the region.
Postsecondary Education UAFS University of Arkansas, Fort Smith • Offers students 70 bachelor’s degree programs in seven colleges and more • than 50 campus organizations. • Also offers over 20 programs for technical and proficient certificates, from • automotive to computer maintenance. JBU John Brown University , Siloam Springs • Offers students 45 bachelor’s degree programs and 3 graduate programs in business, counseling and ministry. • Ranked 2nd among southern regional colleges in the “U.S. News and World Report: America’s Best Colleges” in 2011 More Local Options include NW Technical Institute in Springdale, University of Phoenix in Rogers, and Blue Cliff College in Fayetteville
Postsecondary Education Enrollment for the four major postsecondary educational institutions of NWA. • NWA colleges • are showing rising • enrollment rates, • especially UAF with • over 21, 000 • students last fall.
Total Expenditure Per Pupil • The total expenditure • per pupil is the dollar • amount spent for the • general education of • each student • The 2010 national • expenditure per pupil • is $ 10,297 • (US department • of Education) *Data from 2009
NWA Teacher Salary • Teachers in NWA have a higher starting salary than the state average • Teachers with a Master’s Degree and 15+ years of experience in NWA • get paid almost $10,000 more than the AR average • The average salary for NWA has increased from previous years but is • still lower than both AR and the US Average salary for 2009 AR $47,472 NWA $47,266 US $51,359 *Data from the 2010 Arkansas Education Report, OEP Analysis of Arkansas Teacher Salaries: State, Region, and District
NWA Teacher Salary *Data from the 2010 Arkansas Education Report, OEP Analysis of Arkansas Teacher Salaries: State, Region, and District
Northwest Arkansas Recap • NWA students outperform their state-wide peers on standardized • tests (this includes Benchmark, EOC and AP examinations) • NWA ACT scores are higher than the both AR and the US average • NWA Graduation rate is well above the state average • Enrollment for NWA postsecondary educational institutions continues • to increase • Average NWA Teacher salary is lower than the state, but the starting • salary and MA 15+ years is well above AR
AR Education Reports • Policy Briefs • Report Cards • Newsletters • Data Resources OEP is a research center within the College of Education and Health Professions at the University of Arkansas that specializes in Education Research and Policy. www.uark.edu/ua/oep