Download
1 / 27
270 likes | 417 Views
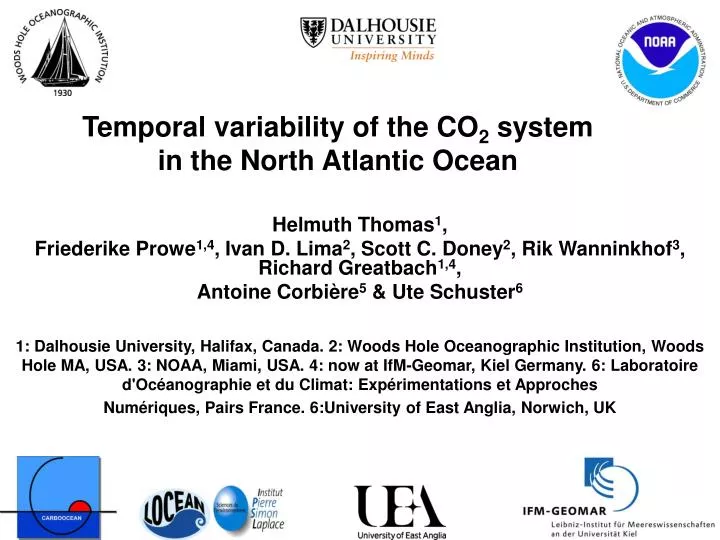
Temporal variability of the CO 2 system in the North Atlantic Ocean. Helmuth Thomas 1 , Friederike Prowe 1,4 , Ivan D. Lima 2 , Scott C. Doney 2 , Rik Wanninkhof 3 , Richard Greatbach 1,4 , Antoine Corbière 5 & Ute Schuster 6.

E N D
Temporal variability of the CO2 system in the North Atlantic Ocean Helmuth Thomas1, Friederike Prowe1,4, Ivan D. Lima2, Scott C. Doney2, Rik Wanninkhof3, Richard Greatbach1,4, Antoine Corbière5 & Ute Schuster6 1: Dalhousie University, Halifax, Canada. 2: Woods Hole Oceanographic Institution, Woods Hole MA, USA. 3: NOAA, Miami, USA. 4: now at IfM-Geomar, Kiel Germany. 6: Laboratoire d'Océanographie et du Climat: Expérimentations et Approches Numériques, Pairs France. 6:University of East Anglia, Norwich, UK
Observations in the North Atlanticduring 1995-2002/4 Thomas et al., 2008, GBC North Sea ΔpCO2declining VOS line UK – Caribbean ΔpCO2 declining Schuster and Watson 2007 Sub Polar North Atlantic ΔpCO2 declining Omar and Olsen, 2006 North Atlantic Drift Region ΔpCO2 declining Lefèvre et al., 2004 South of Greenland ΔpCO2 declining Corbiere et al., 2007 NW Atlantic ΔpCO2 increasing Lueger et al., 2006 BATS, Bermuda ΔpCO2 constant Bates, 2001/7
What is the driver for the observed CO2 flux variability in the North Atlantic Ocean? Simulations for the North Atlantic Ocean • Simulations from 1958-2004 • Community Climate System Model, POP coarse resolution • Ecosystem model coupled to modified OCMIP-II biogeochemistry • NCEP/NCAR reanalysis forcing • Further reading: Doney et al., 2004, Moore et al. 2004, Yeager et al., 2006 • pCO2 decomposition (DICnorm, ATnorm, T, S) • Trend regression analysis • Anthropogenic and preindustrial runs Thomas et al., 2008, GBC
Simulations vs. Observations for the North Atlantic Ocean Thomas et al., 2008, GBC
Nuka Arctica Skògafoss Ocean CO2 trends in the North Atlantic Subpolar Gyre : winter 1993-2003/2001-2008 (based on DIC/TA Suratlant data) Full story presented by Corbière et al. (Poster, CT1)
1994-1995 2002-2005 0 [mol CO2 m-2 yr-1] 1.4 mean UK-Caribbean route Schuster and Watson, 2007 JGR CO2 uptake in 1994/5 and 2002/4 The overall sink (14-65 degrees N): 1995: 0.40 PgC (Takahashi climatology) 2005: 0.24 Pg C for 2005 40% decline in CO2 uptake?
Simulations vs. Observations for the North Atlantic Ocean One conclusion: We need to maintain an observing system. Tool: Trend regression analysis instead of differences.
Simulations vs. Observations for the North Atlantic Ocean Tool: Trend regression analysis instead of differences
Thomas et al. 2008, GBC Simulations vs. Observations for the North Atlantic Ocean pos. NAO Note change in scale! neutr./neg. NAO Most of the observations cover the 95-04 period long term ΔpCO2 trends
Outline 1: Fundamental control 2: Adjustments 3: Overlaying perturbance
1: Fundamental control NAO & the subpolar and subtropical gyres Positive NAO: Strong westerlies Strong NAC Negative NAO: weaker westerlies weaker NAC http://www.noc.soton.ac.uk ↑http://www.ldeo.columbia.edu/res/pi/NAO/ http://www.ldeo.columbia.edu/res/pi/NAO/ ↑
1: Fundamental control North Atlantic Oscillation during the past two decades Thomas et al., 2008, GBC
1: Fundamental control Labrador Current Response of surface ocean to NAO forcing Thomas et al., 2008, GBC Surface velocity positive NAO (1989-1995 average) x Subpolar gyre x Subtropical gyre (each 2nd grid point shown)
1: Fundamental control Response of surface ocean to NAO forcing Surface velocity difference Thomas et al., 2008, GBC Neutral - positive NAO (1996/2004av.) - (1989/1995av.) Labrador Current Subpolar gyre Subtropical gyre (each 2nd grid point shown)
1: Fundamental control Response of surface ocean to NAO forcing Thomas et al., 2008, GBC
1: Fundamental control (one more detail) Thomas et al., 2008, GBC Expansion of subtropical gyre during positive NAO Annual salinity anomalies: Relevance western subpolar gyre: Labrador Current cannot move south, it is diverted into the subpolar gyre
1: Fundamental control Pos. NAO Neutr./neg. NAO Response of surface ocean to NAO forcing
1: Fundamental control Pos. NAO Neutr./neg. NAO DICnorm and Salinity in the North Atlantic North Atlantic Current is fed by low DICnorm / high salinity water: Northward transport of a CO2 deficiency Thomas et al., 2008, GBC
Main driver of variability: DICnorm (AT,norm exerts minor control) Example: 2 stations at the eastern and western subpolar gyre 1: Fundamental control Thomas et al., 2008, GBC WEST Note the phase lag between west and east EAST
1: Fundamental control • Pos. NAO: • Fast NAC • High supply of low DICnorm • High CO2 uptake • Neut. / Neg NAO: • Slow NAC • Low supply of low DICnorm • low CO2 uptake • Long term: • no significant trend Large scale control: NAC and its low DICnorm NAO+ Long term NAO-/ Thomas et al., 2008, GBC Corrected for anthropogenic CO2!!
1: Fundamental control Conclusions 1 • Key process: • NAC exports CO2 sink from the tropics northward • Pos. NAO: • Fast NAC • High supply of low DICnorm • Higher CO2 uptake • Neut. / Neg NAO: • Slow NAC • Low supply of low DICnorm • lower CO2 uptake • Long term: • no significant trend • Temporal aspect: • Observed response depends on distance to NAC source region however:
2: Adjustments Effects of atmospheric temperature Long term • Atm. Temperature effects: • Fast response • Spatially not uniform across the basin • Particularly dominant • in the NW Atlantic Pos. NAO neutr./neg. NAO Note change in scale! Thomas et al., 2008, GBC
3. Overlaying perturbance Perturbing process:Great Salinity anomalies Annual salinity anomalies: Annual DICnorm anomalies: Recall:1. Fundamental control: Pos. NAO = enhanced northward flow of low DICnorm Thomas et al., 2008, GBC
Annual SST anomalies: + NAO neutr./neg. NAO Do we still expect correlations?(??) >60ºN p<0.05 Thomas et al., 2008, GBC
Outline 1: Fundamental control 2: Adjustments 3: Overlaying perturbance
Conclusions • Key process: • NAC exports CO2 sink from the tropics northward • Pos. NAO: • Fast NAC • High supply of low DICnorm • Higher CO2 uptake • Strong cooling in NW Atlantic • Neut. / Neg NAO: • Slow NAC • Low supply of low DICnorm • lower CO2 uptake • Strong warming in NW Atlantic • Alternative view: • Partial redistribution of North Atlantic CO2 sink between subpolar and subtropical gyres • Long term: • no significant trend other than (global) warming and rising atmos. CO2. • Perturbation: • Great Salinity Anomalies Consequences are time variant across the basin because of water mass travel time. High correlations unlikely.
Reference: • Thomas, H., F. Prowe, I.D. Lima, S.C. Doney, R. Wanninkhof, R.J. Greatbatch, A. Corbière and U. Schuster (2008). Changes in the North Atlantic Oscillation influence CO2 uptake in the North Atlantic over the past two decades Global Biogeochemical Cycles, in press.