Download
1 / 19
190 likes | 328 Views
A ustralian A ir Q uality F orecasting S ystem. Peter Manins CSIRO Marine and Atmospheric Research Australia WMO GURME SAG member. Demonstration Project. 0.30. Melbourne. Sydney. Adelaide. 0.25. Perth. Brisbane. 0.20. Canberra. Ozone concentration (ppm). 0.15. 0.10. Air NEPM.

E N D
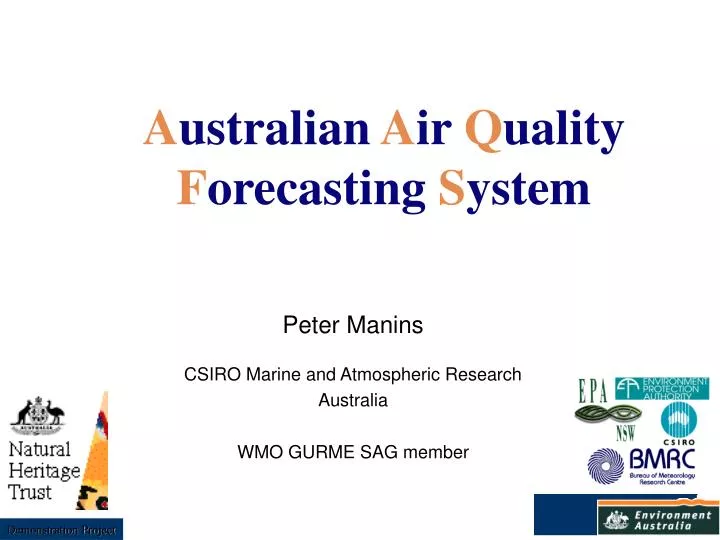
Australian Air Quality Forecasting System Peter Manins CSIRO Marine and Atmospheric Research Australia WMO GURME SAG member Demonstration Project
0.30 Melbourne Sydney Adelaide 0.25 Perth Brisbane 0.20 Canberra Ozone concentration (ppm) 0.15 0.10 Air NEPM 0.05 0.00 1980 1981 1982 1983 1984 1985 1986 1987 1988 1989 1990 1991 1992 1993 1994 1995 1996 1997 1998 1999 Maximum 1-hr ozone levels in Australian cities (Air NEPM = 0.1 ppm) Source: data from environment agencies
AIR QUALITY FORECAST- MELBOURNE 5840 5820 ALP MTC PLP BXH ) m k ( G 5800 PTC N HEAVY I H T R O N 5780 PTH GLS MODERATE FTS GVD PSY 5760 BRI DND 5740 PORT PHILLIP BAY LIGHT 260 280 300 320 340 360 EASTING (km) Tomorrow will be fine and sunny -with moderate to heavy air pollution
Melbourne Eddy Sea Breeze Cold Front Bay Breeze Melbourne –high resolutionneed
WEATHER PREDICTION MET ANALYSIS EPA DATABASE EMISSION MODELLING TRANSPORT AND REACTION AQ + MET OBS. AIR QUALITY FORECAST EVALUATION The System Components BoM-LAPS+CTM
SUPERCOMPUTERS LAPS375 GASP LAPS125 LAPS05 VIC CTM EPA VIC VIC LAPS05 NSW CTM EPA EPA NSW NSW NSW WEB SITE POST - PROCESSING, ARCHIVING, EMAIL GRAPHICS, VERIFICATION FTP ARCHIVE SITE Data Flows for AAQFS
AAQFS Design Features • Generate air quality forecasts twice per day for a period of 24–36 hours: (3 pm and 9 am). • Forecast for a wide range of air pollutants: NOx, ROC, SO2, O3, aerosol, air toxics. • Resolve air quality down to suburb level (5 km, 1 km, and near-road in some cases). • Generate a ‘business as usual’ forecast and a ‘greener emissions’ forecast.
THE SYSTEM THE AUSTRALIAN AIR QUALITY FORECASTING SYSTEM WEATHER MODEL EMISSIONS INVENTORY AIR QUALITY MODEL Tomorrow will be fine and sunny! AIR QUALITY FORECAST
Fleet emissions -Melbourne ROAD-LEVEL EMISSIONS THE SYSTEM TAIL-PIPE EMISSIONS AAQFS Emissions Inventory SOURCE CATEGORIES Cars, trucks, buses, motor cycles, lawn mowers, spray painting combustion stoves, cut grass, trees, dry cleaners, marine pleasure craft, aviation, commercial shipping, rail transport, surface coating/thinners, natural gas leakage, domestic/commercial solvents, service stations, refueling losses, cutback bitumen, domestic aerosols, domestic natural gas combustion, petroleum refining, chemical manufacturing, printing, fabricated metals,basic metal processing, fuel storage, paint manufacturing, food manufacturing,non-metallic mineral processing, hospitals, incinerator, paper products, quarrying textiles, coal mining, WEATHER MODEL EMISSIONS INVENTORY AIR QUALITY MODEL AIR QUALITY FORECAST
Emissions Inventory • Motor vehicle emissions (diurnal, weekly var.) • Domestic wood fires (season, degree days) • Industrial stack plume rise (stability, winds) • Biogenic emissions from soil, vegetation (temperature, PAR, season) • Sea salt aerosol (winds, sea state, temperature) • Wind blown dust (winds, LAI, moisture) • Wild fires and controlled burns (winds, degree days, humidity) As much as possible, these emissions and their interactions with the forecast meteorology are calculated on-line.
SYDNEY MELBOURNE STUDY REGIONS AUSTRALIA
VICTORIA AUSTRALIA Regional CTM domain Urban CTM domain- Melbourne AAQFS in Victoria
Example, The Forecastfor 6 June 01 on the Web: www.epa.vic.gov.au/air/AAQFS not on the Web
NOy NO2 VOC O3 15 March 2001 Example, Summer validation(1)
PM2.5/10 NO2/NOy AQI PM10/NOy 15 March 2001 Example, Summer validation(2)
50th,90th,95th,99th,99.9th,100th percentile concentrations, March 2001 for Melbourne/Geelong
Contingency Table Melbourne & Geelong, March, June-July 2001 Probability of Detection, SP = [Yes,Yes]/Total Obs [Yes] = 69/116 = 59% Fraction of Realised Events, SR = [Yes,Yes]/Total Forecast [Yes] = 69/130 False Alarm Rate, (1-SR) = 61/130 = 47%
PHOTOCHEMICAL SMOG Performance- daily 1-hour O3 max
Why is AAQFS special? • Provides twice-daily forecasts of AQI or RPI (and 18 pollutants) for EPAs on time • Shows the daily development of pollution (highly instructive; web mounted) • Because prognostic, unusual events handled (if Emissions, Weather desc. OK) • Can explore results with powerful display tools and better, slower, models • Alternative scenarios, special locations handled