Download
1 / 11
110 likes | 236 Views
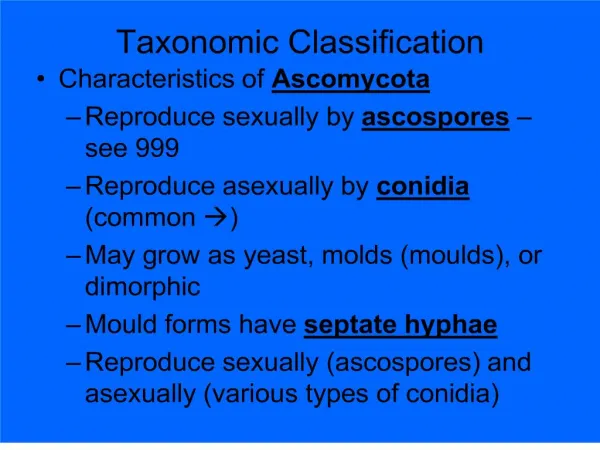
Extending Taxonomic Visualisations. Dealing with Large Datasets, Structural Markers and Synonymy. Large Datasets. Layout Datasets too large to display them in their entirety (in comparison to prev. work) Only layout partial trees

E N D
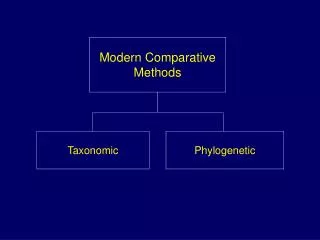
Extending Taxonomic Visualisations Dealing with Large Datasets, Structural Markers and Synonymy
Large Datasets • Layout • Datasets too large to display them in their entirety (in comparison to prev. work) • Only layout partial trees • Top-down layout from current node of interest (anchor node) • Stop drilling down into branch when size of nodes below a threshold • Various hierarchies displayed from top to bottom • Can be opened/closed • Nodes as rectangles • Node colored in top half if has been selected • Summary of user-selected descendants in lower half of node as bar chart • Size of node n by log(size(n))
Large Datasets • Brushing, Navigation and Selection • Left-click re-roots tree at anchor node • Right-click selects subtree rooted at clicked node in all hierarchies (via naming and/or synonymy) • Optionally re-rooting at clicked node • Least common ancestor if clicked node not found in other hierarchies • Brushing temporarily on hover in same fashion as right-click select • Tooltip on hover LCA select
Large Datasets • Brushing, Navigation and Selection • Left-click re-roots tree at anchor node • Right-click selects subtree rooted at clicked node in all hierarchies (via naming and/or synonymy) • Optionally re-rooting at clicked node • Least common ancestor if clicked node not found in other hierarchies • Brushing temporarily on hover in same fashion as right-click select • Tooltip on hover • Text size, Focus & Context influence node size • Focus & Context ratio determines proportion of space allocated for selected and not selected nodes
Large Datasets • Brushing, Navigation and Selection • Left-click re-roots tree at anchor node • Right-click selects subtree rooted at clicked node in all hierarchies (via naming and/or synonymy) • Optionally re-rooting at clicked node • Least common ancestor if clicked node not found in other hierarchies • Brushing temporarily on hover in same fashion as right-click select • Tooltip on hover • Text size, Focus & Context influence node size • Focus & Context ratio determines proportion of space allocated for selected and not selected nodes • Order in sibling groups may be changed • Alphabetically, by rank, by number of child taxa,… • Can help determine size distributions • Can help to find the highest rank within a group of child nodes
Structural Markers • Finding differences between tree revisions can be computationally expensive • Depending on the actual type of change made • Whether exact locations are to be obtained • Visualization requires cheap computation for large datasets • Algorithm checks • Whether selected nodes keep same parent in other hiearchies compared to original hierarchy. • Node is flagged as having had a change and consequently all ancestors up to root node • Flagged nodes are indicated in tree visualization • Hatched: Parent has changed between tree • Stripped: descendent set contains hatched node
Possible Future Work • Comparison of trees at multiple resolutions dependent on sub-tree size • User could benefit from more information on structure change given by more computationally expensive algorithm used on a smaller set of nudes (subtree) • Are users happy with this type of tree visualization? • Any tasks users want to perform on the trees that are not covered? • Synonymy can be given by expert articulations of Euler
Use Case: IT IS Dataset and Structural Markers • 7 Taxonomy Revisions of dataset with each 180.00 – 250.000 taxa • Tasks • Observe whether growth occurred between revisions and where growth is concentrated • If taxa moved between revisions: • Did taxa’s siblings move in the same parent? • New parent otherwise unchanged? • New parent newly formed?
Use Case: IT IS Dataset and Structural Markers • More problematic to discover a taxon that has undergone a purely internal revision.