Download
1 / 44
440 likes | 446 Views
The Human Population and Its Impact. Chapter 6. World Population. http://www.census.gov/popclock/. World Population Distribution. World Population Density. World Land Area. World Population Density.

E N D
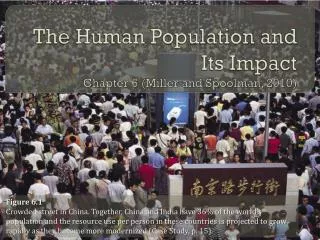
The Human Population and Its Impact Chapter 6
World Population http://www.census.gov/popclock/
World Population Density The size of each territory shows the relative proportion of the world's population living there.
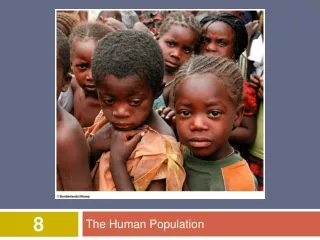
Core Case Study: Are There Too Many of Us? • The world’s population is projected to increase from 7 billion to 9.3 billion between 2012 and 2050. • Much of the world’s population growth occurs in rapidly developing countries like China and India.
Core Case Study: Are There Too Many of Us? • Some argue that the planet has too many people. • Some feel that the world can support billions of more people due to technological advances. • There is a constant debate over the need to reduce population growth. • Must consider moral, religious, and personal freedom. • The debate over interactions among population growth, economic growth, politics, and the impact on the environment is one of the most important and controversial issues in environmental science.
6-1 How Many People Can the Earth Support? • Concept 6-1 We do not know how long we can continue increasing the earth’s carrying capacity for humans without seriously degrading the life-support system for humans and many other species.
Human Population Growth Continues but It Is Unevenly Distributed • Reasons for human population increase: • Movement into new habitats and climate zones • Early and modern agriculture methods • Feed more people per unit of land • Control of infectious diseases through • Sanitation systems • Antibiotics • Vaccines http://www.pbs.org/wgbh/nova/earth/global-population-growth.html
Human Population Growth Continues but It Is Unevenly Distributed • We do not know how long we can continue increasing the earth’s carrying capacity. • There will likely be between 7.2 - 10.6 billion people on earth by 2050. • 97% of growth is in developing countries with many people living in acute poverty. • What is the optimum sustainable population of the earth based on the cultural carrying capacity? • Maximum pop. our planet could support in a sustainable manner that would also allow most people to live in reasonable comfort.
Human Population Growth Continues but It Is Unevenly Distributed • U.N. world population projection based on women having an average of 2.5 (high), 2.0 (medium), or 1.5 (low) children. • In 2006, the population of developed countries grew at 0.1% per year. • Developing countries grew 15 times faster at 1.5% per year.
Science Focus: How Long Can the Human Population Keep Growing? • Thomas Robert Malthus (1798) • He predicted that the human population would grow exponentially while food production would increase linearly • Human population growth would outstrip the Earth's carrying capacity and that disease and famines would limit humanity's growth. • Although humans have altered 83% of the earth’s land surface, his predictions have not yet come true. • Technology has allowed food production to increase exponentially as well… ...for now.
6-2 What Factors Influence the Size of the Human Population? • Concept 6-2A Population size increases because of births and immigration and decreases through deaths and emigration. • Concept 6-2B The average number of children born to women in a population (total fertility rate) is the key factor that determines population size.
Populations Can Grow, Shrink, or Remain Stable • Populations increase through: • Births • Immigration= arrival of individuals from outside the population • Populations decrease through: • Deaths • Emigration = departure of individuals from the population
Instead of using raw numbers, crude birth rates and crude death rates are used . Based on total number of births or deaths per 1,000 people in a population It makes it possible to compare birth/death rates for countries with greatly different total populations. It’s also much easier to find population growth rates using the crude birth/death rates than using the raw numbers The Human Population Can Grow, Decline, or Remain Fairly Stable
Global Connections: Crude birth/death rates Population comparison
The average number of children that a woman bears has dropped sharply. However, this decline is not enough to stabilize the world’s population in the near future. Replacement-level fertility: the number of children a couple must bear to replace themselves. 2.1 in developed, 2.54 in developing Why difference between developed/developing? Total fertility rate (TFR): the average number of children a woman has during her reproductive years. 2.7 worldwide (1.6 in developed, 2.9 in developing) Women Having Fewer Babies but Not Few Enough to Stabilize the World’s Population
U.S. pop. grew by nearly 2.9 million people in 2008: 66% occurred because of births outnumbering deaths. ~34% came from illegal and legal immigration. Case Study: The U.S. Population Is Growing Rapidly In 2008, the TFR in the United States was 2.1 per woman
The baby bust of the 1970’s that followed the baby boom of the 50’s and 60’s was largely due to delayed marriage, more women entering the workforce, contraception, and abortion. Case Study: The U.S. Population Is Growing Rapidly • The population of the U.S. has grown from 76 million in 1900 to 310 in 2010 despite oscillations in TFR and birth rates. • During the Baby Boom (1946-1962) TFR reached 3.7 children per woman.
Case Study: The U.S. Population Is Growing Rapidly http://www.census.gov/2010census/data/
Several Factors Affect Birth Rates and Fertility Rates • The number of children women have is affected by: • Importance of children as part of labor force • The cost of raising and educating them • Urbanization • Education and employment opportunities for women • Infant deaths • Marriage age • Availability of contraception and abortion • Religious beliefs, traditions, cultural norms
Several Factors Affect Death Rates • The rapid growth of the world's population has not been because of increasing birth rates. • It is because of a rapid decrease in death rates. • Life expectancy– the number of years a newborn infant can expect to live. • Death rates have declined because of: • Increased food supplies, better nutrition • Advances in medicine • Improved sanitation and personal hygiene • Safer water supplies
Several Factors Affect Death Rates • Infant mortality rate the number of infants out of every 1,000 who die before their first birthday. • U.S. infant mortality is higher than it should be (ranked 46th world-wide) due to: • Inadequate pre- and post-natal care for poor • Drug addiction • High teenage birth rate • This rate has dropped by almost half from 1991-2006
Migration Affects an Area’s Population SizeCase Study: The United States: A Nation of Immigrants • Since 1820, the U.S. has admitted almost twice as many immigrants and refugees as all other countries combined. • Most migrants seek jobs and economic improvements. • Others come to escape religious, ethnic, or political oppression. • Environmental refugees – people driven out of an area as a result of environmental degradation. • Water shortage, pollution, rise in ocean level, etc.
6-3 How Does a Population’s Age Structure Affect Its Growth or Decline? • Concept 6-3 The numbers of males and females in young, middle, and older age groups determine how fast a population grows or declines.
6-3 How Does a Population’s Age Structure Affect Its Growth or Decline? • The number of people in young, middle, and older age groups determines how fast populations grow or decline. • Age structure categories: • Pre Reproductive, Reproductive, Post Reproductive • The number of people younger than age 15 is the major factor determining a country’s population growth – they arefuture reproducers. • Changes in the distribution of a country’s age groups have long-lasting economic, social, and environmental impacts.
Populations Can Grow, Shrink, or Remain Stable • The proportion of individuals at various ages is the population’s age structure. • Pre-reproductive age: not mature enough to reproduce. • Reproductive age: those capable of reproduction. • Post-reproductive age: those too old to reproduce. • How fast a population grows or declines depends on its age structure: • Young populations can grow fast • Old populations decrease over time • Even age distribution will result in constant population size
Generalized Population Age Structure Diagrams • Populations with a large proportion of its people in the pre-reproductive ages of 1-14 yrs have a large potential for rapid population growth.
A Reminder From Chapter 1: Developed vs. Developing Countries The United Nations classifies the world’s countries into as developed or developing based one their level of industrialization and their per capita GDP.
Population Structure by Age and Sex in Developing and Developed Countries • Nearly 28% of the world’s population (1.9 billion) were under 15 years old in 2008. • Includes 30% of the people in developing countries versus only 17% in developed countries.
Tracking the Baby-Boom Generation in the United States • Today, baby boomers make up nearly half of all adult Americans and dominate the populations demand for goods and services.
Populations Made Up of Mostly Older People Can Decline Rapidly • About 14% of the world’s population live in countries with stabilizing or declining populations. • Japan, Russia, Germany, Italy, Spain, Hungary, Poland, Greece, Ukraine, Czech Republic • Slow decline is manageable • Rapid population decline can lead to long-lasting economic and social problems.
Populations Made Up of Mostly Older People Can Decline Rapidly • Rapid population decline can put severe strains on a country’s budget since older people consume a larger share of medical care, social security funds, and other public services that are paid for by a decreasing number of taxpayers.
Populations Can Decline from a Rising Death Rate: The AIDS Tragedy • Death from AIDS can disrupt a country’s social and economic structure by removing significant numbers of young adults. • 25 million killed by 2008 • Sharp drop in life expectancy • Many young adults die: • loss of most productive workers • International community called upon to: • Reduce the spread of HIV through education and health care • Financial assistance and volunteers
6-4 How Can We Slow Human Population Growth? • Concept 6-4 Experience indicates that the most effective ways to slow human population growth are to encourage family planning, to reduce poverty, and to elevate the status of women.
As Countries Develop, Their Populations Tend to Grow More Slowly • Demographic Transition: As countries become economically developed, their birth and death rates tend to decline. • Preindustrial stage: high infant mortality – results in low population growth rate • Transitional stage: industrialization begins, death rates drops while birth rates remain high – results in high population growth rate • Industrial stage: birth rate drops and approaches death rate – results in small population growth • Postindustrial stage: birth rate declines even further and can be equal to or less than the death rate – results in no growth or even a decline
6-4 How Can We Slow Human Population Growth? • The best way to slow population growth is a combination of: • Investing in family planning – deciding when and how to have children, use of contraception • Reducing poverty – poor families have more children to help with work or in case some die • Elevating the status of women – educated, working women who are involved in the decision making process have less children
Case Studies:Population Growth in China and India China = 1.35 billion people (20% of world’s pop.) • Since 1970, China has used a government-enforced program to cut its birth rate in half and sharply reduce its fertility rate. India = 1.27 billion people (17% of world’s pop.) • For more than five decades, India has tried to control its population growth with only modest success.
Slowing Population Growth in China:the One-Child Policy • Currently, China’s TFR is 1.6 children per women. • China has moved 300 million people out of poverty. • Problems: • Controversial “One Child” policy – couples lose social and economic benefits if they have more than one child • Strong male preference leads to gender imbalance • Average population age is increasing • Not enough resources to support population
Case Study: Slowing Population Growth in India • Poor planning • Bureaucratic inefficiency • Low status of women • Extreme poverty • Lack of administrative financial support • Disagreement over the best ways to slow population growth