Download
1 / 16
160 likes | 162 Views
This article discusses the process of classification and prediction, including model construction, testing, and usage. It explores applications such as credit approval, target marketing, and medical diagnosis. The article also covers supervised and unsupervised learning, data preparation, and evaluating classification methods, as well as decision tree induction.

E N D
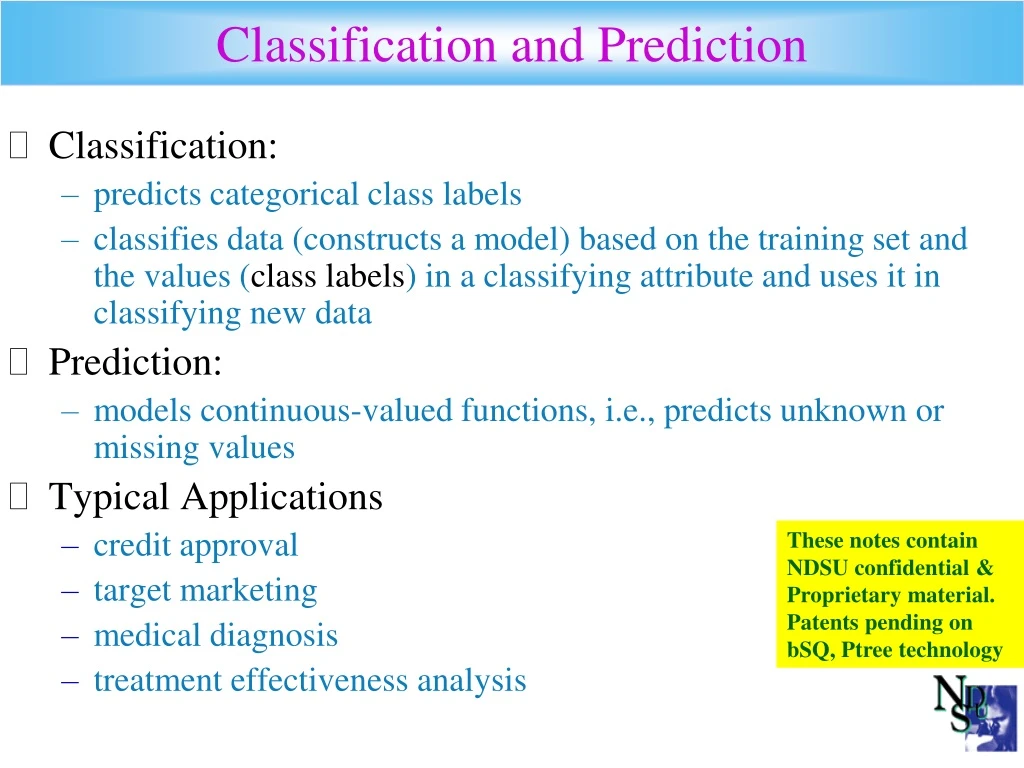
Classification Classification and Prediction • Classification: • predicts categorical class labels • classifies data (constructs a model) based on the training set and the values (class labels) in a classifying attribute and uses it in classifying new data • Prediction: • models continuous-valued functions, i.e., predicts unknown or missing values • Typical Applications • credit approval • target marketing • medical diagnosis • treatment effectiveness analysis These notes contain NDSU confidential & Proprietary material. Patents pending on bSQ, Ptree technology
Classification—A Three-Step Process • Model construction: describing a set of predetermined classes • Each tuple/sample is assumed to belong to a predefined class, as determined by the class label attribute • The set of tuples used for model construction: training set • The model is represented as classification rules, decision trees, or math formulae • Model testing: for classifying future or unknown objects • Estimate accuracy of the model • The known label of test samples are compared with the class results produced by the model. • Accuracy rate is the percentage of test set samples that are correctly classified by the model. • Test set is independent of training set, otherwise over-fitting will occur. • Model usage: for classifying future or unknown objects
Classification Process (1): Model Construction Training Data Classifier (Model) Classification Algorithm (creates the Classifer) IF rank = ‘professor’ OR years > 6 THEN tenured = ‘yes’
Test Process (2) (model acceptable if % correct > 60%) Classifier Testing Data % correct classifications? NAME RANK YEARS TENURED Tom Assistant Prof 2 no Correct=3 Incorrect=1 75% Merlisa Associate Prof 7 no George Associate Prof 5 yes Joseph Assistant Prof 7 no Since 75% is above the acceptability threshold, accept the model!
Supervised vs. Unsupervised Learning • Supervised learning (classification) • Supervision: The training data (observations, measurements, etc.) are accompanied by labels indicating the class of the observations • New data is classified based on the training set • Unsupervised learning(clustering) • The class labels of training data is unknown • Given a set of measurements, observations, etc. with the aim of establishing the existence of classes or clusters in the data
Issues regarding classification and prediction (1): Data Preparation • Data cleaning • Preprocess data in order to reduce noise and handle missing values • Relevance analysis (feature selection) • Remove the irrelevant or redundant attributes • Data transformation • Generalize and/or normalize data
classification/prediction issues(2): Evaluating Classification Methods • Predictive accuracy • Speed and scalability • time to construct the model • time to use the model • Robustness • handling noise and missing values • Scalability • efficiency in disk-resident databases • Interpretability: • understanding and insight provded by the model • Goodness of rules • decision tree size • compactness of classification rules
Classification by Decision Tree Induction • Decision tree • A flow-chart-like tree structure • Internal node denotes a test on an attribute • Branch represents an outcome of the test • Leaf nodes represent class labels or class distribution • Decision tree generation consists of two phases • Tree construction • At start, all the training examples are at the root • Partition examples recursively based on selected attributes • Tree pruning • Identify and remove branches that reflect noise or outliers • Use of decision tree: Classifying an unknown sample • Test the attribute values of the sample against the decision tree
Training Dataset This follows an example from Quinlan’s ID3
Output: A Decision Tree for “buys_computer” age? <=30 overcast >40 30..40 student? credit rating? yes no yes fair excellent no yes no yes
Algorithm for Decision Tree Induction • Basic algorithm (a greedy algorithm) • Tree is constructed in a top-down recursive divide-and-conquer manner • At start, all the training examples are at the root • Attributes are categorical (if continuous-valued, they are discretized in advance) • Examples are partitioned recursively based on selected attributes • Test attributes are selected on the basis of a heuristic or statistical measure (e.g., information gain) • Conditions for stopping partitioning • All samples for a given node belong to the same class • There are no remaining attributes for further partitioning – majority voting is employed for classifying the leaf • There are no samples left
Attribute Selection Measure • Information gain (ID3/C4.5) • All attributes are assumed to be categorical • Can be modified for continuous-valued attributes • Gini index(IBM IntelligentMiner) • All attributes are assumed continuous-valued • Assume there exist several possible split values for each attribute • May need other tools, such as clustering, to get the possible split values • Can be modified for categorical attributes
Information Gain (ID3/C4.5) • Select the attribute with the highest information gain • Assume there are two classes, P and N • Let the set of examples S contain p elements of class P and n elements of class N • The amount of information, needed to decide if an arbitrary example in S belongs to P or N is defined as
Information Gain in Decision Tree Induction • Assume that using attribute A, a set S will be partitioned into sets {S1, S2 , …, Sv} • If Si contains piexamples of P and ni examples of N, the entropy, or the expected information needed to classify objects in all subtrees Si is • The encoding information that would be gained by branching on A
Attribute Selection by Information Gain Computation Class P: buys_computer = “yes” Class N: buys_computer = “no” I(p, n) = I(9, 5) =0.940 Compute the entropy for age: Hence Similarly
Gini Index (IBM IntelligentMiner) • If a data set T contains examples from n classes, gini index, gini(T) is defined as where pj = relative frequency of class j in T. • If a data set T is split into two subsets T1 and T2 with sizes N1 and N2 respectively, the gini index of the split data contains examples from n classes, the gini index gini(T) is defined as • The attribute provides the smallest ginisplit(T) is chosen to split the node (need to enumerate all possible splitting points for each attribute).