Download
1 / 32
320 likes | 322 Views
The Global Burden of Disease Due to Urban Air Pollution: Estimates and Uncertainties. Aaron Cohen Health Effects Institute. CRA project and WHR 2002. www.who.int/whr www.thelancet.com. Urban Air Pollution Working Group. H Ross Anderson (Co-Chair) SGHMS U London

E N D
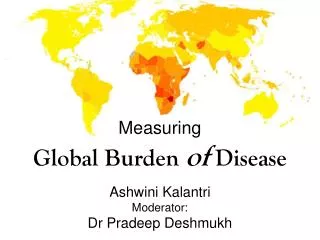
The Global Burden of Disease Due to Urban Air Pollution: Estimates and Uncertainties Aaron Cohen Health Effects Institute
CRA project and WHR 2002 www.who.int/whrwww.thelancet.com
Urban Air Pollution Working Group H Ross Anderson (Co-Chair) SGHMS U London Aaron Cohen (Co-Chair) Health Effects Institute Kersten Gutschmidt WHO/Geneva Michal Krzyzanowski WHO/Euro-Bonn Nino Künzli University of Basel Bart Ostro California Health Dept Kiran Dev Pandey World Bank Arden Pope Brigham Young Isabelle Romieu PAHO Jonathan Samet Johns Hopkins Kirk Smith UC Berkeley
The Global Burden of Disease Due to Urban Air Pollution: Estimates and Uncertainties • The Global Burden of Disease Comparative Risk Assessment • Estimating the Global Burden of Disease Due to Urban Air Pollution • Magnitude and distribution of the attributable burden • Major sources of uncertainty • Estimating the avoidable burden
Risk factors in CRA Child & maternal under-nutrition Childhood and maternal underweight Iron deficiency Vitamin A deficiency Zinc deficiency Other nutrition-related risks & inactivity High blood pressure High cholesterol Overweight and obesity Inadequate fruit and vegetable intake Physical inactivity Addictive substances Smoking and oral tobacco Alcohol Illicit drugs Sexual and reproductive health risks Unsafe sex Non-use and ineffective use of contraception Environmental risks Unsafe water, sanitation, and hygiene Urban air pollution Indoor smoke from solid fuels Lead exposure Climate change Occupational risks Risk factors for injury Carcinogens Airborne particulates Ergonomic stressors Noise Other selected risks to health Contaminated health care injections Child sexual abuse Distributions of risks by poverty
14 WHO mortality sub-regions A: very low child and adult mortality B: low child and adult mortality C: low child, high adult D: high child, high adult E: high child, very high adult
Basic CRA framework and goals • Risk factor-disease relationships • risk accumulation • risk reversal • Risk factor levels • current distribution • counterfactual • distribution(s) Disease burden Attributable burden in 2000 Avoidable burden in 2010 & 2020
Mortality and Burden of Disease • Mortality = Numbers of Deaths • Burden = Disability Adjusted Life Year or DALY • DALY = YLL + YLD • years of life lost because of premature death (YLLs) • years of life lived with disability (YLDs) • one DALY = one lost year of healthy life
Applying the CRA Methods to Urban Air Pollution • Choice of indicator pollutant and estimation of ambient concentrations • Choice of risk factor-disease relationships • Calculation of disease burden
Estimated PM10 Concentration in World Cities (pop >=100,000) PM10 (µg/m3) . 5-14 . 15-29 . 30-59 . 60-99 . 100-254
Population Distribution of Estimated PM10 Levels for 3200 Cities Cohen et al 2004
American Cancer Society II Cohort 500, 000 adults followed 1982 – 1998(Pope et al JAMA 2002) Random effects Cox proportional hazards model controlling for age, sex, race, smoking, education, marital status, body mass, alcohol, occupational exposure and diet
Alternative Scenarios for Burden of Disease Estimation for Urban Air Pollution
Percent change in mean daily number of child and infant deaths
Estimation of attributable deaths and DALYs 1. Calculate region specific relative risk RR2.5 = exp [CR * (X – 7.5)] where CR is slope of the C-R function (β coefficient) and X is regional population weighted mean PM. 2. Calculate Attributable Fraction (AF) AF = P(RR-1) / [ P(RR-1)+1] where P is proportion exposed, i.e. proportion living in cities 3. Calculate attributable deaths and DALYs (AF * regional totals)
Estimated Burden of Urban Air Pollution Worldwide (95% confidence intervals)
Fraction of Deaths Attributable to Outdoor Urban Air Pollution by Region
Mortality attributable to leading risk factors Ezzati et al. 2002; WHO 2002
Summary results for individual risks • Substantial disease burden associated with risk factors such as under-nutrition, poor water and sanitation, and indoor air pollution remain, especially in the poorest developing countries • Simultaneously risks from a number of factors such as smoking, alcohol, and obesity are becoming increasingly global • Some risks, like urban air pollution and lack of contraception are major causes of burden in specific regions
Uncertainties that we quantified • Random variation in exposure and risk coefficient estimates • Choice of PM2.5/PM10 • Choice of counterfactual level • Choice of concentration-response function: coefficients and extrapolation
Uncertainties that we did not quantify • Burden due to pollutants other than PM, e.g., ozone • Burden in cities with populations <100 K • Effects of exposure at finer spatial scales e.g., due to proximity to vehicular traffic • Relative toxicity of PM from different sources • Contribution of other potentially important health outcomes, e.g., LBW, infectious disease
% Ischaemic heart disease 12.6 Cerebrovascular disease 9.7 Lower respiratory infections 6.8 HIV/AIDS 4.9 COPD 4.8 Perinatal conditions 4.3 Diarrhoeal diseases 3.2 Tuberculosis 2.7 Lung cancer 2.2 Malaria 2.2 Road traffic accidents 2.1 % Perinatal conditions 6.5 Lower respiratory infections 6.1 HIV/AIDS5.7 Depression4.5 Diarrhoeal diseases 4.2 Ischaemic heart disease 3.9 Cerebrovascular disease 3.3 Malaria 3.1 Road traffic accidents 2.6 Tuberculosis 2.3 COPD 1.9 Leading Causes of Mortality and Burden of Disease 2002 Mortality DALYs
8.9 Million Cases 1.6 Million Deaths
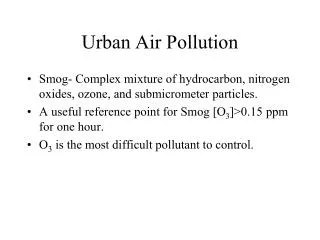
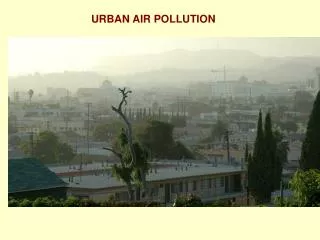
What determines the health effects of air pollution as economies grow? • Number of people in cities • Sources of air pollution • Emissions • Air quality • Susceptibility
Number of people at high CV risk 2000 - 2010 (A Rogers 2005) 36 m 46 m 38 m 18 m 50 m 16 m 45 m 5 m 5 m 12 m 7 m 19 m 1 m 4 m >175 million people at 25%+ risk of a major CV event in the next decade, by WHO subregion A: very low child and adult mortality B: low child and adult mortality C: low child, high adult D: high child, high adult E: high child, very high adult
Reductions in Mortality in Dublin 72 Months Pre- vs. Post-1990 Ban on Coal Sales Clancy et al. Lancet 2002
Thank You acohen@healtheffects.org