Download
1 / 46
490 likes | 555 Views
Urban Air Pollution. Smog- Complex mixture of hydrocarbon, nitrogen oxides, ozone, and submicrometer particles. A useful reference point for Smog [O 3 ]>0.15 ppm for one hour. O 3 is the most difficult pollutant to control. Current standards. http://www.epa.gov/airtrends/ozone.html. O. 3.

E N D
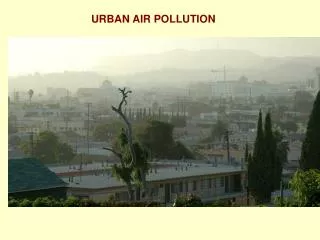
Urban Air Pollution • Smog- Complex mixture of hydrocarbon, nitrogen oxides, ozone, and submicrometer particles. • A useful reference point for Smog [O3]>0.15 ppm for one hour. • O3 is the most difficult pollutant to control.
O 3 R 2 NO O 2 2 R 1 NO fast hv O
O 3 R 2 NO O 2 2 R 1 R = k [NO ] 1 1 2 R = k [O ][NO] 2 2 3 k [NO ] = k [O ][NO] 1 2 2 3 NO fast hv O @ SS, R1= R2
Lets add organic carbon to the mix • CH4 + OH ----> CH3 + H2O • CH3 + O2 + M ----> CH3OO + M (peroxy radical) • CH3OO + NO ----> NO2 + CH3O • CH3O + O2 -----> CH2O + HO2 • HO2 + NO -----> NO2 + OH (NO2 is a source of O3) • CH2O + OH ----> H2O + HCO • HCO + O2 ----> HO2 + CO (HO2, CO are sources of O3)
O 3 R O R 2 NO O O 2 2 2 R 1 H O 2 R = k [NO ] 1 1 2 R = k [O ][NO] 2 2 3 k [NO ] = k [O ][NO] 1 2 2 3 many steps NO OH fast R hv ROO R O R = hydrocarbon @ SS, R1= R2
Lets put this chemistry into perspective What do we need for SMOG? • Sun • Warm Temperature • Hydrocarbons • NOx - Combustion processes
Wind 1-5 hour 1 hour O3, reactive organics aldehydes, olefins increase in OH, NO, NO2, hydrocarbons 5-10 hour other organics NOx + Hydrocarbons NO2 + OH --> HNO3
Not all Hydrocarbons emissions have the same effect! Advancing the understanding of ground-level ozone pollution by Tom Ryerson, Aeronomy Laboratory Research led by scientists at the NOAA Aeronomy Laboratory has illustrated two major factors that could be used to help guide future programs designed to clean up the air downwind of the Nation's fossil-fuel burning electric power plants: the size of the power plant, and the location of the power plant. These power plants emit about one-quarter of the total U.S. human-made contribution of nitrogen oxides, or NOx, to the atmosphere.
O 3 R O R 2 NO O O 2 2 2 R 1 H O 2 R = k [NO ] 1 1 2 R = k [O ][NO] 2 2 3 k [NO ] = k [O ][NO] 1 2 2 3 many steps NO OH fast R hv ROO R O R = hydrocarbon @ SS, R1= R2
MIDAS: miniature differential absorption spectroscopy • Background spectrum from clear air in the stratosphere. • Foreground spectrum measures NO2 concentrations in polluted air • By knowing angle between the flight direction and the wind direction and the wind and flight velocities, they can determine the point source of NO2 Megan L. Melamed ‘00 Melamed, M.L., et. al. “Measuring reactive nitrogen emissions from point sources using visible spectroscopy from aircraft.” Journal of Environmental Monitoring5 (2003): 34. Rose Becker, Lauren Brown, Danny Lin, Megan Watts
Tim Bertram’s Work with Laser-Induced Fluorescence (LIF) Instrument Evan Kaplan, Morgan Davies, Rachel Terry, Carolyn Litty
(left) Example of flight track (blue line) which sampled plumes from power plants of different NOx emission rates. Measurements (black and red lines) superimposed on the track show where the plumes were encountered. (right) Ozone is formed more slowly and in lower yield when NOx concentrations are very high or when reactive VOC concentrations are very low, as shown here by contrasting data from three different power plant plumes. http://www.oar.noaa.gov/spotlite/archive/spot_ozone.html
VOC/NOx Modeling Lindsay Philips, Emmie Theberge, Kristine Robin, Leanne Powers, Doug Rooke http://www-personal.engin.umich.edu/~sillman/ozone.htm
Implications for air quality in the U.S. The U.S. is considering a policy to reduce ozone pollution that would require reductions in NOx emissions from power plants, whereby the overall amount of NOx emitted is decreased, but individual power plants could freely trade emission credits to minimize costs. This NOAA research suggests that emission trading strategies that value all NOx emissions equally might not be optimal with respect to air quality. There could be "good-for-air-quality" trades that result in less ozone pollution, such as trades that move NOx emissions away from high-VOC forested regions, or trades that shift emissions from smaller power plants to larger ones. However, there could also be "bad-for-air-quality" trades that actually result in more ozone pollution being produced, despite a reduction in the overall amount of NOx emitted. In addition, this new NOAA information is also important input into considerations of the location and size of planned new fossil-fuel electric power plants. http://www.oar.noaa.gov/spotlite/archive/spot_ozone.html
Traditional and High Risk Air Quality Measurements Air Quality Index (AQI) - color-coded index representing levels of ozone and other pollutants - AQI value of 100 (0.084 ppm pollutants) represents NAAQS standard - EPA’s AIRNow map Traditional Measurements: Ambient air measurements – measured in ppm (0.12 ppm+ considered unhealthy for anyone) Measurement of trends –higher concentration in summer and downwind of cities. High risk: Measured in terms of exposure risk Groups such as children, people with respiratory diseases and highly active people are more susceptible to ozone exposure – concentrations as low as 0.065 may affect some sensitive people Cities (pop 350,000+) must report when AQI is above standard levels Time spent outdoors or active when AQI is above certain levels should be limited
Main pollutants modeled • Tropospheric Ozone • Nitrous Oxides • Carbon Monoxide • VOC • Particulate Matter • Policy/Regulation • Health Concerns • Emissions Control • Industrial Certification • Accuracy • Why is modeling important? • Modeling forecasts the direction and rates that pollution will travel given weather, distance, and emission rates. • Potential industrial/chemical disasters and environmental effects • Natural disasters (volcanic activity) Air Mass Modeling in the Troposphere Liz Turner, Casey Dunton, Tom Reznick, Nichol Penna
What else is needed? http://www.arl.noaa.gov/ready/hysplit4.html
HYSPLIT and other models How to read the trajectory maps The HYSPLIT trajectory map shows an aerial (plan) view of the path(s) an air parcel(s) took, and a vertical view of its movement at different altitudes. Symbols are used along each trajectory to indicate the position of the air parcel over the calculational period, the interval of which can be defined by the user. The vertical view at the bottom of the map shows the height of the air parcel measured at these corresponding tick marks. The height of the air parcel is measured in meters above model ground level (AGL). http://www.arl.noaa.gov/ready/hysp_info.html#INFO http://www.arl.noaa.gov/ready/open/hysplit4.html
Particulate Matter (PM) DEFINITION • The term for particles found in the air, including dust, dirt, soot, smoke, and liquid droplets. The size, length of time in the atmosphere, and sources of these particles vary. CONCERNS • PM is the cause of many health problems, especially among people with lung and heart problems. • Harms the environment by settling on land and soil and changing the chemical balance. (ex. Making lakes acidic, stripping soil of nutrients) REGULATIONS MADE BY EPA • Passed new emission standards for diesel engines in 1994, reducing PM emissions by 90 percent. • Issued visibility protection regulations in 1999 to reduce haze and erosion, which involved cooperative efforts by states to reduce the amount of PM produced. • The EPA is currently collecting data from various areas and plans to release final PM2.5designations in December of this year. (PM2.5is particle matter 2.5 microns or smaller in diameter.) • http://www.epa.gov/pmdesignations/documents/Mar07/factsheet.htm Source: www.epa.gov
Particles in the Atmosphere • Aerosols: solids and liquids 100 m ---->0.5 mm (sand) • Particles: 1 nm (cluster) ------> 100 m. • Particulate material make up most of the visible form of pollution. • Important in cloud formation, fog formation, heat balance
Atmospheric Chemical Processes involving particles This is a particle! Condensation H2O
Atmospheric Chemical Processes involving particles hv Photochemical processes (R*) Solution phase reactions HCl + NH3 --> NH4Cl Condensation H2O
Atmospheric Chemical Processes involving particles hv Evolution of volatile species (hydrocarbons) Photochemical processes (R*) Solution phase reactions HCl + NH3 --> NH4Cl AB Gas/solid reactions CaO(s) + SO2(g) ---> CaSO3(s) Catalytic surface reactions A + B Condensation H2O
Types of particles • Transient nuclei (AIKEN) particles 2 nm---> 0.1 m • formed from gas phase condensation (hot vapor) • removed by accumulation • Accumulation range particles 0.1 m ----> 1 m -formed from low volatility gases and accumulation processes -removed by rain -these particles do not “settle out of the atmosphere”
Course or Mechanically generated particles 1-100 m. • dust, sea spray, industrial grinding • removed by sedimentation Coagulation Gas condensation Sedimentation
Why do we care about particle size • Health implications • Transport • Reactivity • Information on source functions • How do we measure particle sizes
Where do the particles GO? Stage 1 (5-9) Stage 2 (5-6) Stage 3 (4-5) Stage 4 (2-3) Stage 5 (1-2) Stage 6 (0.5-1) (Diameter in mM)
Natural versus anthropogenic emissions of trace metals to the atmosphere
Organics on Particles (PAH) benzo[a]pyrene-7,8-dihdrodiol -9,10-dihydroepoxide benzo[a]pyrene
Asbestos -Fear and Panic • What is asbestos? • Two major types: • Serpentine(90%) - fiber bundles (Chrysotile Mg6Si4O10(OH)8 • Amphiboles(10%) - rods (Crocidolite Na2(Fe3+)2(Fe2+)2Si8O22(OH)2 ) • Proven carcinogen since 1900’s based on lung tumors in asbestos mine workers • QUESTION: Does the carcinogenicity apply to the general population? POLICY <-->SCIENCE
Asbestos • Why do we use asbestos? • fireproofing • insulation • cement construction • friction materials • sealants • Different types of fibers differ in chemical composition, morphology, durability! • -each fiber type must be considered independently
Does it Kill You? • Yes...but, many questions are unanswered. • The relationship between exposure and lung cancer is approximately linear, but the slope is a function of type and industrial usage! • Chrysotite at current occupational levels may not be dangerous (90% of asbestos). • The US does not differentiate between fibers, Europe does! • Cost! EPA expects asbestos removal in 733,000 buildings in the next 30 years • $53 - $150 billion dollars!
Risk: What are the concentrations? Statistic Schools Outdoor air Public Buildings Median 0.00000 0.00040 Mean 0.00024 0.00039 0.00059 SD 0.00053 0.00198 0.00052 (fibers/cm3 air) The current EPA Limit is 0.2-2 fibers/cm3!
Risk: How bad is the problem? Cause Annual rate (death/106) Whooping cough vaccination (1970-1980) 1-6 Aircraft accidents 6 High School football 10 Drowning (age 5 to 14) 27 Hit by car (age 5 to 14) 32 Long-term smoking 1200 Asbestos exposure in schools 0.005-0.093