Download
1 / 60
630 likes | 869 Views
Quantitative Data Analysis. Dr Ayaz Afsar. Introduction. Quantitative data analysis has no greater or lesser importance than qualitative analysis. Its use is entirely dependent on fitness for purpose.

E N D
Quantitative Data Analysis • DrAyazAfsar
Introduction Quantitative data analysis has no greater or lesser importance than qualitative analysis. Its use is entirely dependent on fitness for purpose. It is a powerful research form, emanating in part from the positivist tradition. It is often associated with large scale research, but can also serve smaller scale investigations, with case studies, action research, correlational research and experiments. In the following, I will show how numerical data can be reported and introduce some of the most widely used statistics that can be employed in their analysis.
Numerical analysis can be performed using software, for example the Statistical Package for Social Sciences (SPSS, Minitab, Excel). Software packages apply statistical formulae and carry out computations. • With this in mind, I will avoid extended outlines of statistical formulae though I do provide details where considered useful. • My aim is to explain the concepts that underpin statistical analyses and to do this in as user-friendly a way as possible. • I will begin by identifying some key concepts in numerical analysis (scales of data, parametric and non-parametric data, descriptive and inferential statistics, dependent and independent variables. Throughout this part, I will indicate how to report analysis.
Scales of data • Before one can advance very far in the field of data analysis one needs to distinguish the kinds of numbers with which one is dealing. This takes us to the commonly reported issue of scales or levels of data, and four are identified, each of which, in the order given below, subsumes its predecessor. • The nominal scale simply denotes categories, 1 means such-and-such a category, 2 means another and so on, for example, ‘1’ might denote males, ‘2’ might denote females. The categories are mutually exclusive and have no numerical meaning. For example, consider numbers on a football shirt: we cannot say that the player wearing number 4 is twice as anything as a player wearing a number 2, nor half as anything as a player wearing a number 8; the number 4 simply identifies a category, and, indeed nominal data are frequently termed categorical data.
The data classify, but have no order. Nominal data include items such as sex, age group (e.g. 30–35, 36–40), subject taught, type of school, socio-economic status. Nominal data denote discrete variables, entirely separate categories, e.g. according females the number 1 category and males the number 2 category (there cannot be a 1.25 or a 1.99 position). • The ordinal scale not only classifies but also introduces an order into the data. These might be rating scales where, for example, ‘strongly agree’ is stronger than ‘agree’, or ‘a very great deal’ is stronger than ‘very little’. It is possible to place items in an order, weakest to strongest, smallest to biggest, lowest to highest, least to most and so on, but there is still an absence of a metric – a measure using calibrated or equal intervals.
Therefore one cannot assume that the distance between each point of the scale is equal, i.e. the distance between ‘very little’ and ‘a little’ may not be the same as the distance between ‘a lot’ and ‘a very great deal’ on a rating scale. One could not say, for example, that, in a 5-point rating scale (1 = strongly disagree; 2 = disagree; 3 = neither agree nor disagree; 4 = agree; 5 = strongly agree) point 4 is in twice as much agreement as point 2, or that point 1 is in five times more disagreement than point 5.
However, one could place them in an order: ‘not at all’, ‘very little’, ‘a little’, ‘quite a lot’, ‘a very great deal’, or ‘strongly disagree’, ‘disagree’, ‘neither agree nor disagree’, ‘agree’, ‘strongly agree’, i.e. it is possible to rank the data according to rules of ‘lesser than’ of ‘greater than’, in relation to whatever the value is included on the rating scale. • Ordinal data include items such as rating scales and Likert scales, and are frequently used in asking for opinions and attitudes. • The interval scale introduces a metric – a regular and equal interval between each data point – as well as keeping the features of the previous two scales, classification and order. This lets us know ‘precisely how far apart are the individuals, the objects or the events that form the focus of our inquiry’ . As there is an exact and same interval between each data point, interval level data are sometimes called equal-interval scales.
The ratio scale embraces the main features of the previous three scales classification, order and an equal interval metric – but adds a fourth, powerful feature: a true zero. This enables the researcher to determine proportions easily – ‘twice as many as’, ‘half as many as’, ‘three times the amount of’ and so on. Because there is an absolute zero, all of the arithmetical processes of addition, subtraction, multiplication and division are possible. Measures of distance, money in the bank, population, time spent on homework, years teaching, income, Celsius temperature, marks on a test and so on are all ratio measures as they are capable of having a ‘true’ zero quantity. • The delineation of these four scales of data is important, as the consideration of which statistical test to use is dependent on the scale of data: it is incorrect to apply statistics which can only be used at a higher scale of data to data at a lower scale. For example, one should not apply averages (means) to nominal data, nor use t-tests and analysis of variances to ordinal data. Which statistical tests can be used with which data are set out clearly later.
Parametric and non-parametric data • Non-parametric data are those which make no assumptions about the population, usually because the characteristics of the population are unknown. • Parametric data assume knowledge of the characteristics of the population, in order for inferences to be able to be made securely; they often assume a normal, Gaussian curve of distribution, as in reading scores. In practice this distinction means this: nominal and ordinal data are considered to be non-parametric, while interval and ratio data are considered to be parametric data. The distinction, as for the four scales of data, is important, as the consideration of which statistical test to use is dependent on the kinds of data: it is incorrect to apply parametric statistics to non-parametric data, it is possible to apply non-parametric statistics to parametric data . Non-parametric data are often derived from questionnaires and surveys while parametric data tend to be derived from experiments and tests (e.g. examination scores).
Descriptive and inferential statistics • Descriptive statistics do exactly what they say: they describe and present data, for example, in terms of summary frequencies. This will include, for example: • the mode (the score obtained by the greatest number of people) • the mean (the average score) • the median (the score obtained by the middle person in a ranked group of people, i.e. it has an equal number of scores above it and below it) • minimum and maximum scores. • the range (the distance between the highest and the lowest scores) • the variance (a measure of how far scores are from the mean, calculated as the average of the squared deviations of individual scores from the mean).
the standard deviation (SD: a measure of the dispersal or range of scores, calculated as the square root of the variance) the standard error (SE: the standard deviation of sample means) • the skewness (how far the data are asymmetrical in relation to a ‘normal’ curve of distribution) • kurtosis (how steep or flat is the shape of a graph or distribution of data; a measure of how peaked a distribution is and how steep is the slope or spread of data around the peak). • Such statistics make no inferences or predictions, they simply report what has been found, in a variety of ways. • Inferential statistics, by contrast, strive to make inferences and predictions based on the data gathered. These will include, for example, hypothesis testing, correlations, regression and multiple regression, difference testing (e.g. t-tests and analysis of variance, factor analysis, and structural equation modelling. • Sometimes simple frequencies and descriptive statistics may speak for themselves, and the careful portrayal of descriptive data may be important. However, often it is the inferential statistics that are more valuable for researchers, and typically these are more powerful.
One-tailed and two-tailed tests • In using statistics, researchers are sometimes confronted with the decision whether to use a one-tailed or a two-tailed test. Which to use is a function of the kind of result one might predict. • In a one-tailed test one predicts, for example, that one group will score more highly than the other, whereas in a two-tailed test one makes no such prediction. The one-tailed test is a stronger test than the two-tailed test as it makes assumptions about the population and the direction of the outcome (i.e. that one group will score more highly than another), and hence, if supported, is more powerful than a two-tailed test.
Dependent and independent variables • Research often concerns relationships between variables (a variable can be considered as a construct, operationalized construct or particular property in which the researcher is interested). • An independent variable is an input variable, that which causes, in part or in total, a particular outcome; it is a stimulus that influences a response, an antecedent or a factor which may be modified (e.g. under experimental or other conditions) to affect an outcome. • A dependent variable, on the other hand, is the outcome variable, that which is caused, in total or in part, by the input, antecedent variable. It is the effect, consequence of, or response to, an independent variable. This is a fundamental concept in many statistics. • For example, we may wish to see if doing more homework increases students’ performance in, say, mathematics. We increase the homework and measure the result and, we notice, for example, that the performance increases on the mathematics test. The independent variable has produced a measured outcome. Or has it?
Maybe: (a) the threat of the mathematics test increased the students’ concentration, motivation and diligence in class; (b) the students liked mathematics and the mathematics teacher, and this caused them to work harder, not the mathematics test itself; (c) the students had a good night’s sleep before the mathematics test and, hence, were refreshed and alert; (d) the students’ performance in the mathematics test, in fact, influenced how much homework they did – the higher the marks, the more they were motivated to doing mathematics homework; (e) the increase in homework increased the students’ motivation for mathematics and this, in turn may have caused the increase in the mathematics test; (f) the students were told that if they did not perform well on the test then they would be punished, in proportion to how poorly they scored.
Many statistics operate with dependent and independent variables (e.g. experiments using t-tests and analysis of variance, regression and multiple regression); others do not (e.g. correlational statistics, factor analysis). If one uses tests which require independent and dependent variables, great caution has to be exercised in assuming which is or is not the dependent or independent variable, and whether causality is as simple as the test assumes. • Further, many statistical tests are based on linear relationships (e.g. correlation, regression and multiple regression, factor analysis) when, in fact, the relationships may not be linear. • The researcher has to make a fundamental decision about whether, in fact, the relationships are linear or non-linear, and select the appropriate statistical tests with these considerations in mind. • To draw these points together, the researcher will need to consider:
What scales of data are there? • Are the data parametric or non-parametric? • Are descriptive or inferential statistics required? • Do dependent and independent variables need to be identified? • Are the relationships considered to be linear or non-linear? • The prepared researcher will need to consider the mode of data analysis that will be employed. This is very important as it has a specific bearing on the form of the instrumentation. For example, a researcher will need to plan the layout and structure of a questionnaire survey very carefully in order to assist data entry for computer reading and analysis; an inappropriate layout may obstruct data entry and subsequent analysis by computer. • The planning of data analysis will need to consider:
What needs to be done with the data when they have been collected – how will they be processed and analysed? • How will the results of the analysis be verified, cross-checked and validated? • Decisions will need to be taken with regard to the statistical tests that will be used in data analysis as this will affect the layout of research items (for example in a questionnaire), and the computer packages that are available for processing quantitative and qualitative data, e.g. SPSS and NUD.IST respectively.
Reliability • We need to know how reliable is our instrument for data collection. Reliability in quantitative analysis takes two main forms, both of which are measures of internal consistency: the split-half technique and the alpha coefficient. Both calculate a coefficient of reliability that can lie between 0 and 1. • Internal consistency can be found in Cronbach’s alpha, frequently referred to simply as the alpha coefficient of reliability. The Cronbach alpha provides a coefficient of inter-item correlations, that is, the correlation of each item with the sum of all the other items. This is a measure of the internal consistency among the items (not, for example, the people). It is the average correlation among all the items in question, and is used for multi-item scales.
Exploratory data analysis: frequencies,percentages and cross-tabulations This is a form of analysis which is responsive to the data being presented, and is most closely concerned with seeing what the data themselves suggest, akin to a detective following a line of evidence. The data are usually descriptive. Here much is made of visual techniques of data presentation. Hence frequencies and percentages, and forms of graphical presentation are often used. A host of graphical forms of data presentation are available in software packages, including, for example: • frequency and percentage tables • bar charts (for nominal and ordinal data) • histograms (for continuous – interval and ratio – data) • line graphs • pie charts • high and low charts • scatterplots • stem and leaf displays • box plots (box and whisker plots).
With most of these forms of data display there are various permutations of the ways in which data are displayed within the type of chart or graph chosen. While graphs and charts may look appealing, it is often the case that they tell the reader no more than could be seen in a simple table of figures, which take up less space in a report. Pie charts, bar charts and histograms are particularly prone to this problem, and the data in them could be placed more succinctly into tables. • Clearly the issue of fitness for audience is important here: • some readers may find charts more accessible and able to be understood than tables of figures, and this is important. Other charts and graphs can add greater value than tables, for example, line graphs, box plots and scatterplots with regression lines, and I would suggest that these are helpful. • Here is not the place to debate the strengths and weaknesses of each type, although there are some guides here:
Bar charts are useful for presenting categorical and discrete data, highest and lowest. • Avoid using a third dimension (e.g. depth) in a graph when it is unnecessary; a third dimension to a graph must provide additional information. • Histograms are useful for presenting continuous data. • Line graphs are useful for showing trends, particularly in continuous data, for one or more variables at a time. • Multiple line graphs are useful for showing trends in continuous data on several variables in the same graph. • Pie charts and bar charts are useful for showing proportions. • Interdependence can be shown through cross-tabulations. • Box plots are useful for showing the distribution of values for several variables in a single chart, together with their range and medians. • Stacked bar charts are useful for showing the frequencies of different groups within a specific variable for two or more variables in the same chart. • Scatterplots are useful for showing the relationship between two variables or several sets of two or more variables on the same chart.
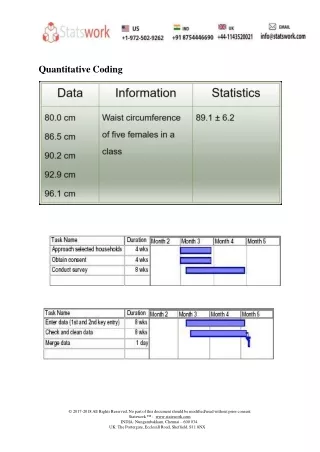
Table 1 (Box.1) At a simple level one can present data in terms of frequencies and percentages (a piece of datum about a course evaluation). From this simple table we can tell that: 191 people completed the item. Frequencies and percentages for a course evaluation. The course was too hard Frequency Percentage Valid Not at all 24 12.6 Very little 49 25.7 A little 98 51.3 Quite a lot 16 8.4 A very great deal 4 2.1 Total 191 100.0
Most respondents thought that the course was ‘a little’ too hard (with a response number of 98, i.e. 51.3 percent); the modal score is that category or score which is given by the highest number of respondents. • The results were skewed, with only 10.5 per cent being in the categories ‘quite a lot’ and ‘a very great deal’. • More people thought that the course was ‘not at all too hard’ than thought that the course was ‘quite a lot’ or ‘a very great deal’ too hard. • Overall the course appears to have been slightly too difficult but not much more.
Let us imagine that we wished to explore this piece of datum further. We may wish to discover, for example, the voting on this item by males and females. This can be presented in a simple cross-tabulation, following the convention of placing the nominal data (male and female) in rows and the ordinal data (the 5-point scale) in the columns. A cross-tabulation is simply a presentational device, whereby one variable is presented in relation to another, with the relevant data inserted into each cell (see the following box).
The above table shows that, of the total sample, nearly three times more females (38.2 per cent) than males (13.1 per cent) thought that the course was ‘a little’ too hard, between two-thirds and three-quarters more females (19.9 per cent) than males (5.8 per cent) thought that the course was a ‘very little’ too hard, and around three times more males (1.6 per cent) than females (0.5 per cent) thought that the course was ‘a very great deal’ too hard. However, one also has to observe that the size of the two subsamples was uneven. Around three-quarters of the sample were female (73.8 per cent) and around one-quarter (26.2 per cent) was male.
There are two ways to overcome the problem of uneven subsample sizes. One is to adjust the sample, in this case by multiplying up the subsample of males by an exact figure in order to make the two subsamples the same size (141/50 = 2.82). Another way is to examine the data by each row rather than by the overall totals, i.e. to examine the proportion of males voting such and such, and, separately, the proportion of females voting for the same categories of the variable ( See Box. 3 below).
In the above table, one can observe that: There was consistency in the voting by males and females in terms of the categories ‘a little’ and ‘quite a lot’.
More males (6 per cent) than females (0.7 per cent) thought that the course was ‘a very great deal’ too hard. • A slightly higher percentage of females (91.1 per cent: {12.1 per cent + 27 per cent + 52 per cent}) than males (86 per cent: • {14 per cent + 22 per cent + 50 per cent}) indicated, overall, that the course was not too hard. • The overall pattern of voting by males and females was similar, i.e. for both males and females the strong to weak categories in terms of voting percentages were identical. • I would suggest that this second table is more helpful than the first table, as, by including the row percentages, it renders fairer the comparison between the two groups: males and females. • Further, I would suggest that it is usually preferable to give both the actual frequencies and percentages, but to make the comparisons by percentages. I will say this, because it is important for the reader to know the actual numbers used.
For example, in the first table, if we were simply to be given the percentage of males voting that the course was a ‘very great deal’ too hard (1.6. per cent), as course planners we might worry about this. However, when we realize that 1.6 per cent is actually only 3 out of 141 people then we might be less worried. Had the 1.6 per cent represented, say, 50 people of a sample, then this would have given us cause for concern. Percentages on their own can mask the real numbers, and the reader needs to know the real numbers. • It is possible to comment on particular cells of a cross-tabulated matrix in order to draw attention to certain factors (e.g. the very high 52 per cent in comparison to its neighbour 8.5 per cent in the voting of females in the table above). It is also useful, on occasions, to combine data from more than one cell, as done in the example above.
For example, if we combine the data from the males in the categories ‘quite a lot’ and ‘a very great deal’ (8 per cent + 6 per cent = 14 per cent) we can observe that, not only is this equal to the category ‘not at all’, but also it contains fewer cases than any of the other single categories for the males, i.e. the combined category shows that the voting for the problem of the course being too difficult is still very slight. • Combining categories can be useful in showing the general trends or tendencies in the data. • For example, in the tables (Boxes 1 to 3), combining ‘not at all’, ‘very little’ and ‘a little’, all of these measures indicate that it is only a very small problem of the course being too hard, i.e. generally speaking the course was not too hard. • Combining categories can also be useful in rating scales of agreement to disagreement. For example, consider the following results in relation to a survey of 200 people on a particular item (Box 4 in the following).
There are several ways of interpreting the Box above, for example, more people ‘strongly agreed’ (20 per cent) than ‘strongly disagreed’ (15 per cent), or the modal score was for the central neutral category (a central tendency) of ‘neither agree nor disagree’. However, one can go further. If one wishes to ascertain an overall indication of disagreement and agreement then adding together the two disagreement categories yields 35 per cent (15 per cent + 20 per cent) and adding together the two agreement categories yields 30 per cent (10 per cent + 20 per cent), i.e. there was more disagreement than agreement, despite the fact that more respondents ‘strongly agreed’ than ‘strongly disagreed’, i.e. the strength of agreement and disagreement has been lost. By adding together the two disagreement and agreement categories it gives us a general rather than a detailed picture; this may be useful for our purposes.
However, if we do this then we also have to draw attention to the fact that the total of the two disagreement categories (35 per cent) is the same as the total in the category ‘neither agree nor disagree’, in which case one could suggest that the modal category of ‘neither agree nor disagree’ has been superseded by bimodality, with disagreement being one modal score and ‘neither agree nor disagree’ being the other. • Combining categories can be useful although it is not without its problems, for example let us consider three tables (Boxes 5 to 7). The first presents the overall results of an imaginary course evaluation, in which three levels of satisfaction have been registered (low, medium,high) (Box 5).
Here one can observe that the modal category is ‘low’ (95 votes, 42.2 per cent)) and the lowest category is ‘high’ (45 votes, 20 per cent), i.e. overall the respondents are dissatisfied with the course. The females seem to be more satisfied with the course than the males, if the category ‘high’ is used as an indicator, and the males seem to be more moderately satisfied with the course than the females. However, if one combines categories (low and medium) then a different story could be told (Box 6). • By looking at the percentages, here it appears that the females are more satisfied with the course overall than males, and that the males are more dissatisfied with the course than females. However, if one were to combine categories differently (medium and high) then a different story could be told (Box 7).
By looking at the percentages, here it appears that the females are more satisfied with the course overall than males, and that the males are more dissatisfied with the course than females. However, if one were to combine categories differently (medium and high) then a different story could be told (Box 7).
By looking at the percentages, here it appears that there is not much difference between the males and the females, and that both males and females are highly satisfied with the course. At issue here is the notion of combining categories, or collapsing tables, and I will suggest great caution in doing this. Sometimes it can provide greater clarity, and sometimes it can distort the picture. • In the example it is wiser to keep with the original table rather than collapsing it into fewer categories. • In examining data we can look to see how evenly or widely the data are distributed. For example, a line graph shows how respondents voted on how well learners are guided and supported in their learning, awarding marks out of ten for the voting, with a sample size of 400 respondents (Box. 8).
One can see here that the data are skewed, with more votes being received at the top end of the scale. There is a long tail going to the negative end of the scores, so, even though the highest scores are given at the top end of the scale, we say that this table has a negative skew because there is a long tail down. • By contrast, let us look at a graph of how much staff take on voluntarily roles in the school, with 150 votes received and awarding marks out of 10 (Box 9).
Here one can observe a long tail going toward the upper end of the scores, and the bulk of the scores being in the lower range. Even though most of the scores are in the lower range, because the long tail is towards the upper end of the scale this is termed a positive skew. The skewness of the data is an important feature to observe in data, and to which to draw attention. • If we have interval and ratio data then, in addition to the modal scores and cross-tabulations, we can calculate the mean (the average) and the standard deviation. Let us imagine that we have the test scores for 1,000 students, on a test that was marked out of 10 (Box 10).
Here we can calculate that the average score was 5.48. We can also calculate the standard deviation, which is a standardized measure of the dispersal of the scores, i.e. how far away from the mean/average each score is. It is calculated, in its most simplified form (there being more than one way of calculating it), as:
A low standard deviation indicates that the scores cluster together, while a high standard deviation indicates that the scores are widely dispersed. This is calculated automatically by software packages such as SPSS at the simple click of a single button. • In the example here the standard deviation in the example of scores was 2.134. What does this tell us? • First, it suggests that the marks were not very high (an average of 5.48). • Second, it tells us that there was quite a variation in the scores. • Third, one can see that the scores were unevenly spread, indeed there was a high cluster of scores around the categories of 3 and 4, and another high cluster of scores around the categories 7 and 8. • This is where a line graph could be useful in representing the scores, as it shows two peaks clearly (Box 11).