Download
1 / 23
270 likes | 345 Views
Quantitative Data Analysis. Social Research Methods 2109 & 6507 Spring, 2006 March 6 2006. Quantitative Analysis: convert data to a numerical form and statistical analyses. quantification ( 量化 ): the process of converting data to a numerical format ( 將資料轉換成數字形式 ). Quantification of Data.

E N D
Quantitative Data Analysis Social Research Methods 2109 & 6507 Spring, 2006 March 6 2006
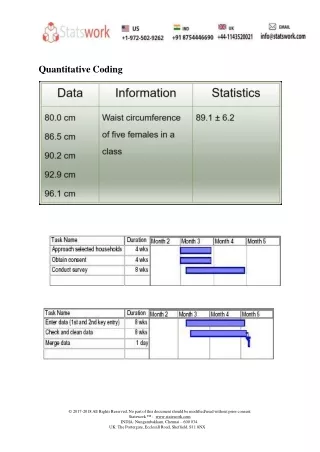
Quantitative Analysis: convert data to a numerical form and statistical analyses quantification (量化): the process of converting data to a numerical format (將資料轉換成數字形式)
Quantification of Data • Develop codes and a codebook • Coding data (資料編碼) • Data entry (資料輸入) • Data file construction (資料檔的建立) • Statistical Analyses
Quantitative Data Analyses • Univariate analyses (單變量分析): a single variable • Distributions, central tendency, dispersion, subgroup comparisons • Bivariate analyses (雙變量分析): the analysis of two variables • Multivariate analyses (多變量分析): analyzing more than two variables simultaneously
Univariate Analysis • Distributions (分配) • Frequency distribution (can use a graph) • Central tendency (the form of an average) (集中趨勢) • The arithmetic mean (算數平均數) • The mode (the most frequently occurring attribute) (眾數) • The median (the middle attribute in the ranked distribution of observed attributes) (中位數)
Univariate Analysis • Dispersion (離差): the way values are distributed around some central value (ex: an average) • The simplest measure: the range • Standard deviation: an index of the amount of variability
Please note: some calculations are not suitable to all variables • Continuous variables (quantitative variables) (連續變數): a variable whose attributes form a steady progression • Ex: age • Discrete variables (qualitative variables) (間斷變數): a variable whose attributes are separate from one another, or discontinuous • Ex: gender • Nominal or ordinal variables
Bivariate Analysis Explanatory bivariate analyses: consider causal relationships (考慮兩個變數的因果關係) Explanatory or Independent Variables vs. Response or Dependent Variables
Measures of association • The basic idea: proportionate reduction of error (PRE) (消減錯誤的比例) • If you know the relationship between the two variables, you will make fewer errors in guessing values of one variable if you know values of the other. • Today: focus on correlation (相關係數)
A Scatterplot (散佈圖): display the relationship between two quantitative variables measured on the same individuals(能顯示二量化變數的關係)
Looking at a scatterplot • Look for direction, form, and strength of the relationship • Direction (方向): • Positive association (正相關) • Negative association (負相關)
Looking at a scatterplot • Form (形式): what shape or pattern? • 直線? 曲線? 集中? 分散? • Strength: the points in the scatterplot lie to a simple form (a line or a curve?) (圖中各點多接近一直線或曲線?)
Outlier (極端值): an individual obs. falling outside the overall pattern of the graph
The correlation coefficient (r) • Correlation (r): a measure of the strength and direction of the linear relationship between two quantitative variables (二量化變數直線關係的強度及方向) • r can take on values from -1 to 1
Facts about correlation: • A positive value of r: a positive association • A negative value of r: a negative association • r closer to 1 or -1: stronger association • r = 0 : no association • r : measures the strength of linear association • r (y, x) = r (x, y) • r: sensitive to outliers
More about correlations • How big is a correlation? No hard and fast rule • In general: abs(r) >0.7--- strong association • But in social sciences, r is usually not strong in terms of its value (< 0.7)
To get r in SPSS: • 分析(A) →相關(C) →雙變量
Conclusions about correlation: • Scatterplots: the first step when considering the association between two quantitative variables • r: summarize the strength of linear association • Distinct (but related) to the slope of the regression line