Download
1 / 67
710 likes | 1.4k Views
FETWATER Pilot Training. 20 - 24 August 2018. Water Resources Management From Hydrology to Yield. Contents. Hydrological Cycle Rainfall Streamflow Catchment Developments Evaporation Stochastic hydrology Yield. 1. The Hydrological Cycle. Understanding catchments.

E N D
FETWATER Pilot Training 20 - 24 August 2018 Water Resources Management From Hydrology to Yield
Contents Hydrological Cycle Rainfall Streamflow Catchment Developments Evaporation Stochastic hydrology Yield
One can not do water resources Management without Rainfall data Number of useable rainfall stations open over time
Why do we need rainfall data? • Water resource, source of streamflow / groundwater • Can affect requirements eg. Irrigation • Intensity eg. flood management • Early warning eg. Drought cycles • Long term cyclic trends, climate change
Where to obtain rainfall data from? • DWS Management Framework Rainfall • SAWS: costs • Other • Satellite • Varying time frames: monthly, daily, hourly
Collating Rainfall Data • Raw data should be checked • Patched with surrounding rainfall gauges with available data • Individual gauges usually lumped together to obtain representative catchment rainfall
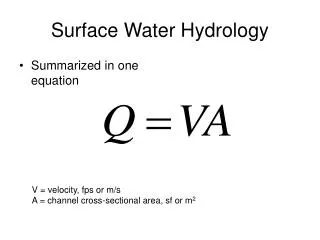
Why do we need streamflow data? • To understand the volume of rainfall that produces surface flows • Natural streamflow data is known as “hydrology” • Yield analyses of water resources requires hydrology • Flow measurements important for operating systems eg. EWR & users’ requirements
Where to obtain streamfow data from? Google Earth KMZ file
Rainfall-Runoff Relationships • More rainfall = more runoff • Lag can occur • Further material under Pitman Modelling Module
Quick Practical • What was the monthly flow out of Jericho Dam in March 1991? • What was the rainfall measured at gauge 0297159W in January 1984?
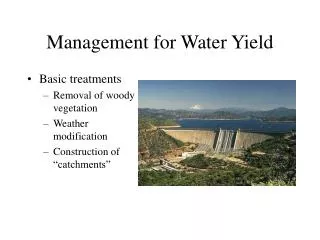
Afforestation Irrigation
Urbanisation Alien vegetation Dryland crops Transfers
Why should they be considered? • Often negative impact on streamflow • Quantifying difficult • Changes in flow over time • “Natural Streamflow” required for water resources management assessments
Vaal dam surface area when full: 322.75 km2 = 322 750 000 m2 2000 mm = 2 m 2m x 322 750 000 m2 = 645.5 million m3/a Storage of Vaal Dam = 2610 million m3 therefore 25%
Required for • Surface water evaporation losses from Dams, rivers • Crop evapotranspiration in determining crop water requirements Types • Lake • S-Pan • A-Pan • Crop
Obtained from • Water Resources studies • Usually constant per year, monthly distribution
What are stochastics? • Alternative to Natural hydrology sequence • Only 1 change: rainfall, not dependant on landuse/catchment development changes • Eg. of Vaal Rainfall Cumulative Avg: 648mm
Sequence 1 ? Avg: 648mm Sequence 2 Sequence 3
Sequence 1 ? Avg: 648mm Avg: 645mm Sequence 2 Sequence 3 Avg: 665mm Avg: 637mm
Why use stochastics? • Eliminates the need to plan according to historic events only • Can provide results in terms of assurance of supply, probability of failure (more later) • Use STOMSA to produce stochastic flow sequences from natural historic sequence
What is yield? • Available water from a water resource system • Volume of water that can be abstracted over a specific time period • Varying types: • Historic firm • Long term at various assurance levels • Short term
Spill Recovery tC Failure Critical period Full Supply Volume (FSV) Storage volume Dead Storage Volume (DSV) Time
Definition of Modelling “… a simplified mathematical description of a system or process, used to assist calculations and predictions…” – Oxford English Dictionary
Benefits of modelling • Allows representation of real world, subject to various human activities / interventions • Can predict behaviour prior to actual experience • Provides testing environment to assess best options for application in real world • Allows “mistakes” without applying incorrect or inappropriate options • Guides design of corrective measures
Limitations of modelling • Cannot capture full complexities of real world • Dependent on assumptions • Data availability • Selection of appropriate model • Difficult to standardise modelling approach • Specialist configuration and interpretation • Small user group • Extensive configuration checking
Purpose • Assessment • Resource capability • Resource assurance • Water quality • Impact of interventions • Conservation • Resource development • Impact of management options • Resource operation • System maintenance • Monitoring of observed behaviour
The modelling process • Define objectives • Identify main physical features • Define system network • Select system operating rules • Undertake scenario analysis • Evaluate results • Implement decision
Models and utilities • Hydrological and water quality data pre-processors (various) • Data patching utilities (CLASSR, PATCHR) • Rainfall-runoff models (Pitman) • Stochastic streamflow models (STOMSA) • Water quality models (WQT) • Yield analysis models (WRYM) • Planning analysis models (WRPM) • Information management systems (WR-IMS)
Undeveloped catchment Runoff Available flow
Available flow Average flow Available flow 4035302520151050 Monthly flow volume (million m3) 0 1 2 3 4 5 6 7 8 9 10 Year
Abstraction from river Water user Abstraction Runoff Available flow
Abstraction capacity Actual supply Actual supply Available flow 4035302520151050 Average flow Monthly flow volume (million m3) 0 1 2 3 4 5 6 7 8 9 10 Year
Reservoir Abstraction from reservoir Water user Abstraction Runoff