Download
1 / 33
340 likes | 489 Views
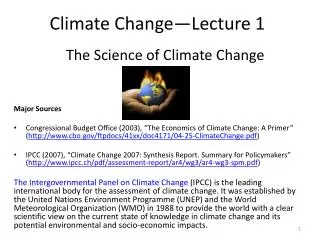
The Science of Climate Change - Overview. Primary Source: IPCC WG-I - Summary for Policymakers. Intergovernmental Panel on Climate Change (IPCC). Established in 1988 by World Meteorological Organization (WMO) United Nations Environment Programme (UNEP)

E N D
The Science of Climate Change - Overview Primary Source: IPCC WG-I - Summary for Policymakers
Intergovernmental Panel on Climate Change (IPCC) • Established in 1988 by • World Meteorological Organization (WMO) • United Nations Environment Programme (UNEP) Supports the UN Framework Convention on Climate Change (UNFCCC) • adopted in 1992 and entered into force in 1994. • overall policy framework for climate change issue
Role of IPCC "assess on a comprehensive, objective, open and transparent basis the scientific, technical and socio-economic information relevant to understanding the scientific basis of risk of human-induced climate change, its potential impacts and options for adaptation and mitigation" (source: www.ipcc.ch)
Role of IPCC "The IPCC does not carry out research nor does it monitor climate related data or other relevant parameters. It bases its assessment mainly on peer reviewed and published scientific/technical literature." (source: www.ipcc.ch)
IPCC Working Groups & Task Force Working Group I - "The Physical Science Basis" Working Group II - "Impacts, Adaptation and Vulnerability" Working Group III - "Mitigation of Climate Change" Task Force on National Greenhouse Gas Inventories (source: www.ipcc.ch)
IPCC Working-Group Reports First Assessment Report - 1990 Second Assessment Report - 1995 Third Assessment Report (TAR) - 2001 Fourth Assessment Report (AR4) - 2007 Plus: special reports, technical papers, methodology reports and supporting material. (source: www.ipcc.ch)
Climate Change 2007: The Physical Science BasisWorking Group I Contribution to the IPCC Fourth Assessment ReportPresented by R.K. Pachauri, IPCC ChairandBubu Jallow, WG 1 Vice ChairNairobi, 6 February 2007
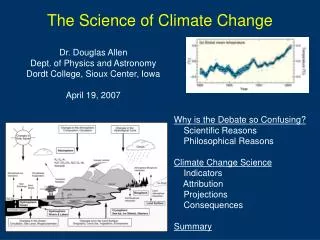
DIRECT OBSERVATIONS OF RECENT CLIMATE CHANGE Since the TAR, progress in understanding how climate is changing in space and in time has been gained through: • improvements and extensions of numerous datasets and data analyses • broader geographical coverage • better understanding of uncertainties, and • a wider variety of measurements
Direct Observations of Recent Climate Change Warming of the climate system is unequivocal, as is now evident from observations of increases in global average air and ocean temperatures, widespread melting of snow and ice, and rising global mean sea level.
Direct Observations of Recent Climate Change Gobal mean temperature Global average sea level Northern hemisphere Snow cover
Warmest 12 years: 1998,2005,2003,2002,2004,2006, 2001,1997,1995,1999,1990,2000 50 0.1280.026 100 0.0740.018 Global mean temperatures are rising faster with time Period Rate Years /decade
Arctic vs Globalannual temperature anomalies (°C) Warming in the Arctic is double that for the globe from 19th to 21st century and from late 1960s to present. Warmth 1925 to 1950 in Arctic was not as widespread as recent global warmth. Note different scales
Proportion of heavy rainfalls: increasing in most land areas Regions of disproportionate changes in heavy (95th) and very heavy (99th) precipitation
Drought is increasing most places Mainly decrease in rain over land in tropics and subtropics, but enhanced by increased atmospheric demand with warming The most important spatial pattern (top) of the monthly Palmer Drought Severity Index (PDSI) for 1900 to 2002. The time series (below) accounts for most of the trend in PDSI.
Marked increase after 1994 North Atlantic hurricanes have increased with SSTs N. Atlantic hurricane record best after 1944 with aircraft surveillance. Global number and percentage of intense hurricanes is increasing (1944-2005) SST
1979-2003 1951-1978 1901-1950 Warm nights are increasing; cold nights decreasing fewer more fewer more Frequency of occurrence of cold or warm temperatures for 202 global stations for 3 time periods: 1901 to 1950 (black), 1951 to 1978 (blue) and 1979 to 2003 (red).
Snow cover and Arctic sea ice are decreasing Spring snow cover shows 5% stepwise drop during 1980s Arctic sea ice area decreased by 2.7% per decade (Summer: -7.4%/decade)
Glaciers and frozen ground are receding Area of seasonally frozen ground in NH has decreased by 7% from 1901 to 2002 Increased Glacier retreat since the early 1990s
Direct Observations of Recent Climate Change Some aspects of climate have not been observed to change: • Tornadoes • Dust-storms • Hail • Lightning • Antarctic sea ice
A Paleoclimatic Perspective Paleoclimate information supports the interpretation that the warmth of the last half century is unusual in at least the previous 1300 years. The last time the polar regions were significantly warmer than present for an extended period (about 125,000 years ago), reductions in polar ice volume led to 4 to 6 metres of sea level rise.
Human and Natural Drivers of Climate Change CO2, CH4 and N2O Concentrations - far exceed pre-industrial values - increased markedly since 1750 due to human activities Relatively little variation before the industrial era
CO2 CH4 The atmospheric concentration of CO2 and CH4 in 2005 exceeds by far the natural range of the last 650,000 years
Human and Natural Drivers of Climate Change The understanding of anthropogenic warming and cooling influences on climate has improved since the Third Assessment Report (TAR), leading to very high confidencethat the globally averaged net effect of human activities since 1750 has been one of warming, with a radiative forcing of +1.6 [+0.6 to +2.4] W m-2.
Attribution Observations • are observed changes consistent with • expected responses to forcings • inconsistent with alternative explanations All forcing Solar+volcanic
Understanding and Attributing Climate Change Continental warming likely shows a significant anthropogenic contribution over the past 50 years
Understanding and Attributing Climate Change Most of the observed increase in globally averaged temperatures since the mid-20th century is very likely due to the observed increase in anthropogenic greenhouse gas concentrations. This is an advance since the TAR’s conclusion that “most of the observed warming over the last 50 years is likely to have been due to the increase in greenhouse gas concentrations”. Discernible human influences now extend to other aspects of climate, including ocean warming, continental-average temperatures, temperature extremes and wind patterns
Projections of Future Changes in Climate Continued greenhouse gas emissions at or above current rates would cause further warming and induce many changes in the global climate system during the 21st century that would very likely be larger than those observed during the 20th century. • Best estimate and assessed likelihood range for future temperature projections for first time • Broadly similar to the TAR but not directly comparable
Projections of Future Changes in Climate • For the next two decades a warming of about 0.2°C per decade is projected for a range of SRES emission scenarios. • Even if the concentrations of all greenhouse gases and aerosols had been kept constant at year 2000 levels, a further warming of about 0.1°C per decade would be expected. • Earlier IPCC projections of 0.15 to 0.3 oC per decade can now be compared with observed values of 0.2 oC
Projections of Future Changes in Climate Best estimate for low scenario (B1) is 1.8°C(likely range is 1.1°C to 2.9°C), and for high scenario (A1FI) is 4.0°C (likely range is 2.4°C to 6.4°C). Broadly consistent with span quoted for SRES in TAR, but not directly comparable
Projections of Future Changes in Climate Projected warming in 21st century expected to be greatest over land and at most high northern latitudes and least over the Southern Ocean and parts of the North Atlantic Ocean
Projections of Future Changes in Climate Precipitation increasesvery likely in high latitudes Decreaseslikely in most subtropical land regions
END The Science of Climate Change - Overview