Download

1 / 17
170 likes | 177 Views
SESAMO: a decision support system for the Multi Criteria Analysis. Project Final Meeting Aosta, May 24th 2012. Fiorella GRASSO, Stefano MARAN (PP3). SESAMO. SESAMO is a decision support system based on the methodology of the multi criteria analysis.

E N D
SESAMO: a decision support system for the Multi Criteria Analysis Project Final Meeting Aosta, May 24th 2012 Fiorella GRASSO, Stefano MARAN (PP3) Aosta, May 24th 2012
SESAMO SESAMO is a decision support system based on the methodology of the multi criteria analysis. Aosta, May 24th 2012
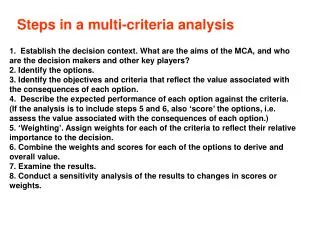
The MCA application in SESAMOstep by step Identify the alternatives Identify criteria and indicators and build the evaluation tree Aggregate indicators Quantify indicators Choice the utility functions Weight indicators and criteria (with the contribution of different stakeholders) Evaluate the performance of each alternative Perform the sensitivity analysis (uncertainty influence on alternative performance) The MCA procedure in SESAMO is articulated in 8 different steps: Aosta, May 24th 2012
1. Identify the alternatives • Firstly, you have to create an MCA project and identify the alternatives. no MIF 40% MIF 20% MIF A project alternative must represent all the possible actions that a designer is able to do to influence future events. Aosta, May 24th 2012
1. Identify the alternatives An alternative is able to have an influence on the indicators representing the system. In other words, each alternative will produce some modification on some indicators, but not necessarily on all of them. Aosta, May 24th 2012
2. Identify criteria, indicators The hierarchical structure of theevaluation tree Aosta, May 24th 2012
3. Let’s aggregate indicators You can assign to a criterion a value that is derived from the aggregation of its children nodes. For example, you can assign to the hydrological regime the weighted average of th regimes for each month of the year. For example, you can assign to the hydrological regime the weighted average of th regimes for each month of the year. Aosta, May 24th 2012
4. Quantify criteria and indicators Then, we get anevaluation matrix thealternativesare on the columns thecriteriaare on the lines Aosta, May 24th 2012
5. Choice the utility functions We can express the decision maker satisfaction about a single indicator by using the Utility Functions • Through the normalization process of the Utility Functions, the indicators loose their dimension and BECOME COMPARABLE each other because they are transformed in adimensional values. Aosta, May 24th 2012
6. Assign weights Weights represent the mechanism through which a stakeholder can express his idea about the relative importance among criteria. Aosta, May 24th 2012
6. Assign weights Free Weights Allocation This technique consists on assigning a weight to each leaf of the tree, without taking into account the hierarchic structure of the criteria. Aosta, May 24th 2012
6. Assign weights Hierarchical weights allocation It is possible to assign coefficients for every group of nodes that are children of the same node, for every level of the tree. Inside each group, the sum of the coefficients must be equal to 1. 1 0.6 0.2 0.5 0.3 0.4 0.2 0.2 0.2 0.4 Aosta, May 24th 2012
7. Performances of the alternatives The ranking of the alternatives This chart highlights which of the selected criteria gives the biggest contribution to the final result. Aosta, May 24th 2012
7. Performances of the alternatives The graph represents the overall performance of the selected alternatives, computed considering all criteria. In this representation, the radius represents the utility value, while the angle represents the weight. Aosta, May 24th 2012
8. Perform the Sensitivity Analysis A decisional process is strongly influenced by the concepts of uncertainty and subjectivity. In this panel you can analyse how robust is the rankingof the alternatives, in relation to the given vector of weights. The sensitivity analysis allows to understand how the final ranking of the alternatives can vary if impacts, utility functions or weights assume values that are not the reference values. Aosta, May 24th 2012
8. Perform the Sensitivity Analysis More attentionto the environment More attention to the production Aosta, May 24th 2012
8. Perform the Sensitivity Analysis The “dashboard” controls are used to change the height of the weight in relation with the others; you can view the performance of the alternatives Aosta, May 24th 2012