Download
1 / 25
250 likes | 346 Views
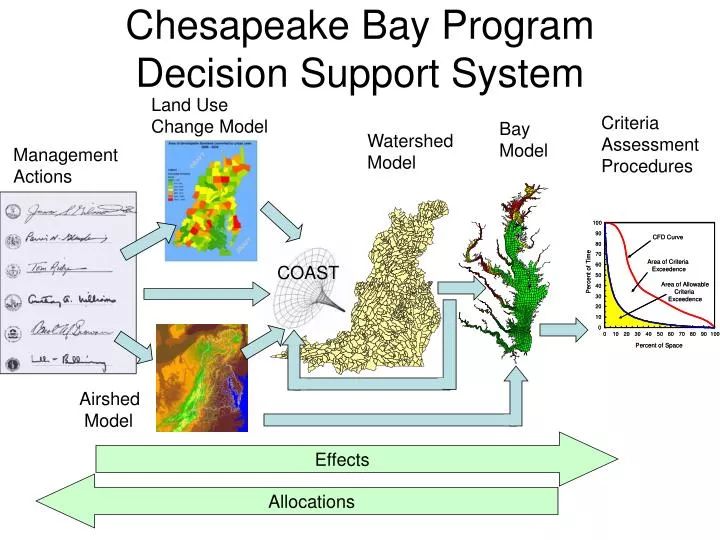
Chesapeake Bay Program Decision Support System. Land Use Change Model. Criteria Assessment Procedures. Bay Model. Watershed Model. Management Actions. COAST. Airshed Model. Effects. Allocations. Hourly Values: Rainfall Snowfall Temperature Evapotranspiration Wind

E N D
Chesapeake Bay ProgramDecision Support System Land Use Change Model Criteria Assessment Procedures Bay Model Watershed Model Management Actions COAST Airshed Model Effects Allocations
Hourly Values: Rainfall Snowfall Temperature Evapotranspiration Wind Solar Radiation Dewpoint Cloud Cover Annual or Monthly: Land Use Acreage BMPs Fertilizer Manure Atmospheric Deposition Point Sources Septic Loads Quick overview of watershed model Calibration HSPF Daily output compared To observations
High Density Pervious Urban High Density Impervious Urban Low Density Pervious Urban Low Density Impervious Urban Construction Extractive Wooded Disturbed Forest Corn/Soy/Wheat rotation (high till) Corn/Soy/Wheat rotation (low till) Other Crops Alfalfa Nursery Pasture Degraded Riparian Pasture Animal Feeding Operations Fertilized Hay Unfertilized Hay Nutrient management versions of the above Each segment consists of separately-modeled land uses Plus Point Source and Septic Each calibrated to nutrient and Sediment targets
WSM Uses:Divide Load into contributing areas and sources Ultimate Source Land Use Source
WSM Uses:Determine Effective Practices From the Chesapeake Bay Commission Report: Cost-Effective Strategies for the Bay December, 2004
WSM Uses:Track Implementation Progress Cap Load Allocation
WSM Uses:Estimate annual loads below monitoring stations Roughly 25% of the total load is unmonitored
2003 Decision:Reduce annual loads to 175 million lbs TN and 12.8 million lbs TP
Phase 5 Development Phase 4 Phase 5
Large Community of Developers Maryland Department of the Environment Virginia Department of Conservation and Recreation Chesapeake Bay Program $ Developers EPA U of Maryland USGS NRCS Chesapeake Research Consortium Virginia Tech Interstate Commission on the Potomac River Basin $ $ Advisors and data suppliers State Governments of NY, PA, MD, DE, VA, WV, DC Scientific and Technical Advisory Committee USGS
Fine Segmentation Phase 4.3 Calibration Phase 5 Calibration Calibration sites = 20 Land Segments = 94 River Segments = 94 Land uses = 9 Simulation Years = 10 Calibration sites = 296 Land Segments = 308 River Segments= 1,063 Land uses = 25 Simulation Years = 20
Flexible Functionality ETM Functionality Additional CBPO-coded features allow: • Greater Accuracy: • Time Varying Land Use • Time Varying BMPs • BMP efficiency reacting to hydrologic condition • Design life of BMPs • Sub-grid effects (differential land-to-river transport) • Easier Data Handling • Easily allows large-scale parameter adjustments during calibration • Parallel computing operations convenient • Easy to add new land use types • Easily integrated into outside databases for scenarios • Relatively easy to add new WQ constituents (bacteria)
High Resolution Input Data Rainfall Snowfall Temperature Evapotranspiration Wind Solar Radiation Dewpoint Cloud Cover Land Use Acreage BMPs Fertilizer Manure Atmospheric Deposition Point Sources Septic Loads Better, extended, and finer scale data sets Simulation period is 1984-2005: Two decades of meteorology and watershed management data
Transferability Open-Source Model • Entire model available on web • Already in Use • Climate Change Study • Community model at ICPRB • Potomac PCB TMDL • MDE TMDLs • USGS Factors Affecting Trends • USGS Shenandoah Models • Academic studies • UNC / Baltimore LTER study • 60-year ‘Tipping point’ investigation
Automated Calibration • Ensures even treatment across jurisdictions • Fully documented calibration strategy • Repeatable • Makes Calibration Feasible • Enables uncertainty analysis
Chesapeake Bay ProgramDecision Support System Land Use Change Model Criteria Assessment Procedures Bay Model Watershed Model Management Actions COAST Airshed Model Effects Allocations
Non-attaining water vs annual cost Tier2 Tier1 Tier3
Difficult Consensus Tier3 Drastic Option
Estuarine model used to determine basins with highest effect on DO Increasing effect of each pound of reduction
Effect of Geographic Targeting Tier3 Efficient Option Drastic Option
Nitrogen-Phosphorus-Sediment Load Allocation Process ...then by 20 major tributary basins by jurisdiction …then by 44 state-defined tributary strategy subbasins By 9 major river basins Watershed States Responsibility Watershed States Responsibility Watershed Partners Responsibility