Download
1 / 30
300 likes | 395 Views
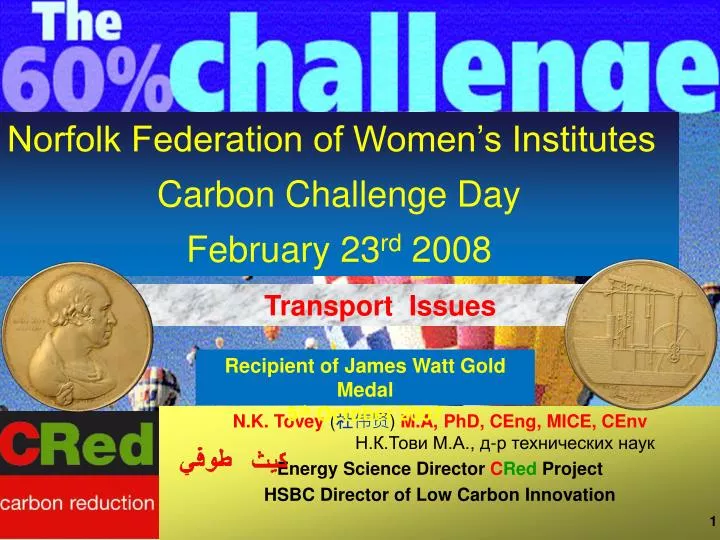
N.K. Tovey ( 杜伟贤 ) M.A, PhD, CEng, MICE, CEnv Н.К.Тови М.А., д-р технических наук Energy Science Director C Red Project HSBC Director of Low Carbon Innovation. Norfolk Federation of Women’s Institutes Carbon Challenge Day February 23 rd 2008. Transport Issues.

E N D
N.K. Tovey (杜伟贤) M.A, PhD, CEng, MICE, CEnv Н.К.Тови М.А., д-р технических наук Energy Science Director CRedProject HSBC Director of Low Carbon Innovation Norfolk Federation of Women’s Institutes Carbon Challenge Day February 23rd 2008 Transport Issues Recipient of James Watt Gold Medal 5th October 2007 1
Historic Trends Technical Issues Fuel Efficiency New Fuels The Social Dimension How important is it? New Ideas Carbon Footprint Issues Conclusions Transport Issues
Historic Trends: Personal Mobility Increase in personal mobility by ~400% in 50 years Mostly by car journeys Decline in bus travel (but trend now reversed ) Nearly 50% increase in rail travel since privatisation represents a saving of 1.5 - 2 millions tonnes of CO2 per annum compared to road. Privatisation If this travel is replacing road travel!! Will investment in public transport necessarily reduce car journeys?
Private Motoring Components of Energy Demand in personal transport. Desire for mobility exceeded fuel efficiency improvements until 1990. Since 2000 energy consumption approximately in balance. Need to reduce further increases in mobility if CO2 is to be reduced significantly.
Historic Trends: Freight Distance each tonne has travelled has increased by: 223% since 1960 20% since 1990 Is this increase in movement of freight conducive to optimum economic growth, energy security, and carbon reduction?
Energy Labelling: Is it helpful? Band G covers a broad range Base taxation directly on carbon emission? Data from Vehicle Emissions Database
Carbon and Energy Efficiency Trends in Cars voluntary emission targets will not be reduced to 140 g/km by 2008/09
Technical Issues: New Fuels Biofuels: one part of the solution in near term with Fuel Cells in longer Term?? Overall CO2 emissions for different fuels/production methods/power trains. Based on CONCAWE/JRC/EUCAR results as adapted by Andy Taylor 9
Technical Issues: New Fuels • Biofuel Options • Biogas • Bioethanol (5% or 85%) • Biodiesel (5% to 100%) • Vegetable oil • Benefit • > Reduced CO2 and other emissions? Depending on the pathway, biofuels can have a major impact in reducing CO2 from transport.However, other studies give differing results and clarity and robustness of methodolgy is needed – including “Real Road Tests”
Launch of BioEthanol in UK: Norwich 15th March 2006 Planning is neededboth for vehicles and infrastructure
Historic Trends Technical Issues Fuel Efficiency New Fuels The Social Dimension How important is it? New Ideas Carbon Footprint Issues Conclusions Transport Issues
Biodiesel Trials – Banham Poultry 2004 First trials ever of fuel economy ‘on the road’ using biodiesel 8 Volvo FH12 Trucks:5%, 20%, 35%, 50% biodiesel blends • Despite reduced calorific value of biodiesel, • fuel consumption remained the same
Biodiesel Trials – Banham Poultry Driver behaviour • Driver behaviour can affect performance • Driver 2 uses 13.8% more fuel than driver 1
Trials demonstrated other benefits compounding to 60% saving Using 50% uvo biodiesel (~40% saving) Advanced driver training (~15% saving): cumulative ~49% Better route/load planning (~10% saving): cumulative ~54% More fuel-efficient trucks (~10% saving): cumulative ~59% Total CO2 saving ~59% However Widespread availability of biodiesel at this concentration and new trucks will take time Other actions could be taken in shorter time scale Advanced driver training (~15% saving): Better route/load planning (~10% saving): Total CO2 saving ~24% Biodiesel Trials – Banham Poultry
Implications of Road Transport Fuel Obligation for 2010 In UK it is 5% substitution of biofuels by volume. Should it be 5% by energy? Will the buy out money necessarily end up promoting UK projects as with Renewable Obligation? Significant quantities of wheat are exported which could be used for bioethanol. Land Area required for 5% by volume ~10000 – 12000 sq km (similar to NFU figure of 1.2 Mha) or 4-5% of total land area of UK. area of Norfolk, Suffolk, and part of Cambridgeshire combined Opportunities for use of co-products- animal feed/power generation What happens if RTFO is increased further? Is land area requirement sustainable?
Trends in Car Engine Size Car engine sizes are getting larger. This increase has caused the emission of an extra 2.9 Mtonnes extra of CO2. per annum. Data from Transport Statistics 2005. Table 2005. 17
Size of Car Engines in Market 2006 1000 - 1300 1003 - 1600 <1000 1600 - 2000 2000 - 2500 2500 - 3000 >3000 Percentage of models available compared to social desire. -ve means less models on market than people intending to buy. Size of Choice according to survey of prospective buyers Data: Vehicle Emission Database Department of Transport Report: Assessing the Impact of Graduated Vehicle Excise Duty”
Fuel Consumption and Driver Behaviour Car: 5 door Toyota Yaris Real performance is best at ~ 50 mph. Saves up to 15% in fuel consumption cf 70 mph. Driver behaviour at low to moderate speeds can affect consumption by up to 10%% Raising Awareness • A small car emits: equivalent of 1 party balloon every 60m. • Driving just 1.6 miles emits as much carbon dioxide as heating an old persons room for 1 hour.
Personal Mobility: Does Public Transport reduce car travel? UK UK D D UK D More use of car > more total distance travelled. Greater distance by train > greater use of car. Compare UK with Germany switch UK car journeys to public transport at German levels. saving by train 1.01 M tonnes saving by bus 0.74 M tonnes Reducing mobility desire 9.22 M tonnes Suggests overriding issue is increased desire for mobility rather than significant switching of mode of transport.
Investment in Public Transport • Smart Dynamic Bus Routing? • Bus Service A > B • People at C not served • Divert route via C • increased journey times less popular with A > B, particularly if people only occasionally get on at C. • Dynamic Routing on demand • Extension of Trinidad Route Bus System B C A • Mobile phone SMS • Intelligent bus stops
Social Issues: Lift SharingOur congested roads are full of empty seats Car travel (2006 statistics): • 679 billion passenger kilometres • 398 billion vehicle kilometres Average occupancy 1.71. Raising this to an average of 2 would save 9.9 Mtonnes CO2. Lift sharing/car pooling is very cost effective, can help combat social exclusion, and enhance the effectiveness of public transport. Increasing average car occupancy is a very cheap way of saving CO2 and reducing car use. The UK leader in lift sharing, Liftshare.com is based in Norfolk; Aim: CO2, Car Occupancy 2 52 million km shared each year.
Social Issues: First car share club in East Anglia However, some research of Cambridge scheme by Prof. Crawford Brown suggests that much of use is additional use not replacement use. EDP, June 2, 2006
Providing Public with more information Impact of carbon emissions Petrol receipt from Denmark • Individuals often go for budget airlines for the cheap weekend break in Europe. Is this rational? • e.g. Paris for weekend break Prices as per respective WEB Sites on 19th Sept. 2006
Historic Trends Technical Issues Fuel Efficiency New Fuels The Social Dimension How important is it? New Ideas Carbon Footprint Issues Conclusions Transport Issues
Carbon Emissions from Train Travel Norwich – Peterborough Saturday 24th March 2007 Data Collected by Energy Field Course Students en route for Orkney.
Carbon Emissions from Train Travel Peterborough - Aberdeen
Carbon Emissions from Train Travel Edinburgh - Aberdeen
Carbon Emissions from Train Travel A Problem Driving to London ~ 32 kg of CO2 Travelling by Train ~ 4.5 kg – a saving of 27.5 kg based on data from our research BUT If travelling by car the train would still run. What would be the reduction in CO2 because a person did not travel [ 85 – 90% of energy consumption arises from dead weight of train] Reduction is only around 0.4 kg [ weight of person plus luggage] So true saving by public transport is about 31.6kg How do you then account for emissions by the train???????
Conclusions Are Biofuels an answer? Government needs clearer statements on its commitments: e.g.RTFO. Why not a requirement of 5% by energy content? Where will buy out money go? Will it promote industry in UK? Land requirements in post 2010 ideas from increased RTFO? Issues of fuel efficiency need addressing more effectively Reverse trend towards large engine cars Revisit the banding system and related taxation • Social Dimension must not be overlooked. • Better education/awareness - driver behaviour. • Address issue of continual increases in desire for mobility. • Could provide more rapid and cheaper method to reduce CO2? "If you do not change direction, you may end up where you are heading." LaoTzu (604-531 BC) Chinese Artist and Taoist philosopher