Download
1 / 13
140 likes | 150 Views
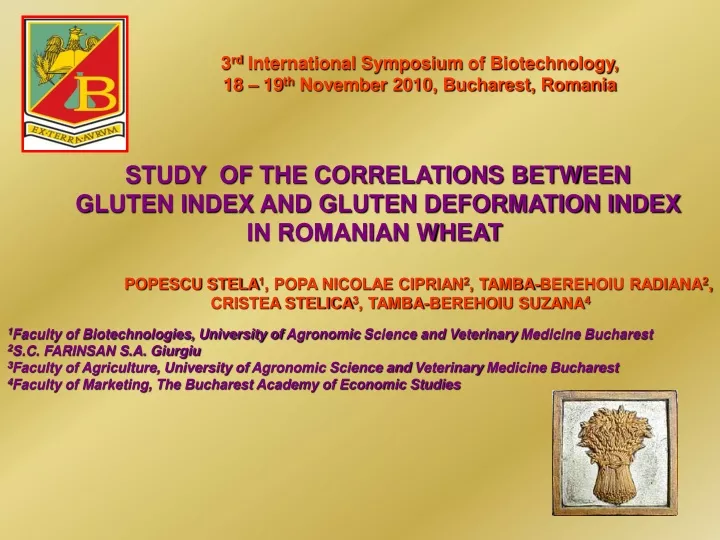
3 rd International Symposium of Biotechnology, 18 – 19 th November 2010, Bucharest, Romania. STUDY OF THE CORRELATIONS BETWEEN GLUTEN INDEX AND GLUTEN DEFORMATION INDEX IN ROMANIAN WHEAT .

E N D
3rd International Symposium of Biotechnology, 18 – 19th November 2010, Bucharest, Romania STUDY OF THE CORRELATIONS BETWEEN GLUTEN INDEX AND GLUTEN DEFORMATION INDEX IN ROMANIAN WHEAT POPESCU STELA1, POPA NICOLAE CIPRIAN2, TAMBA-BEREHOIU RADIANA2, CRISTEA STELICA3, TAMBA-BEREHOIU SUZANA4 1Faculty of Biotechnologies, University of Agronomic Science and Veterinary Medicine Bucharest 2S.C. FARINSAN S.A. Giurgiu 3Faculty of Agriculture, University of Agronomic Science and Veterinary Medicine Bucharest 4Faculty of Marketing, The Bucharest Academy of Economic Studies
INTRODUCTION • Wheat production in Romania is characterized by large variations in crop quality from one year to another, especially the variation of some parameters which reflect the enzymatic activity (falling number, strain index). • The assessment of gluten quality is done through the excessive use of a single descriptor, namely the index of deformation, due to lack of popularity among wheat manufacturers and processors of other methods for evaluating the quality of gluten, as Zeleny index or gluten index [1] • The gluten index parameter can be a good predictor for a range of rheological parameters of dough (extensograph, alveograph, mixograph and farinograph) [3, 4, 5, 6]. • The deformation index, which significantly reflects the level of the attack of bed bugs (Eurygaster sp.), the Gluten index parameter is influenced to a large extent by the genetical heritage of wheat varieties [7,8]. • The optimal values for the deformation index parameter are situated in the range 6-13 mm. A lower value than 6 shows a tenacious gluten, and a value greater than 20 mm a low gluten, characterized by a very rapid process of proteolytic degradation. • The Gluten Index parameter can take values between 0 and 100. The optimal value is considered between 65 and 80. Values greater than 80 describe a strong gluten. Values less than 65 describe a gluten having initially a moderate proteolytic activity for the values between 40 and 65, and a very strong activity for smaller values than 40. [9].
MATERIAL AND METHODS • 650 wheat samples (crops of the years 2005 – 2009, taken from the southern region of Romania ) • Main tested parameters: • - hectolitric mass (ISO 7971-2), • - moisture (ICC Standard No . 202), • - wet gluten and gluten index (ICC Standard No 155), • - protein content (ICC Standard No. 202), • - ash content(AACC Standard No. 08-21), • - falling number (ISO 3093:1997) • - deformation index (STAS 6283/1-83).
RESULTS AND DISCUSSION Estimates the variability of quality parameters of wheat samples • The analyzed wheat was characterized by relatively low values of the gluten index and average values of deformation index. In terms of the reference values expressed in the specialized literature, the two parameters present a moderate to high proteolytic activity. • Gluten index coefficient of variation has been very high (55.187%), similar to the variation level of the deformation parameter index (72.744%).
The correlation coefficients for the quality parameters of wheat samples M - Moisture, HW - Hectolitric Weight, PC - Protein content, WG - Wet gluten, GI – Gluten Index, FN – Falling Number, GD – Gluten Deformation; *significant (p<0.050), **distinct significant (p<0.010), *** very significant (p<0.001) The deformation index, as well as the gluten index, highlight the same correlations except the correlation between deformation index and humidity (r = -0.22).
The regression Gluten index–Wheat Deformation index Gluten deformation index increased significantly with the decrease of the parameter value of gluten index. Although both parameters express proteolytic activity of wheat, variation of one parameter explains variation of the other only to an extent of 37% (index of determination R2 = 0.366). If we accept the assumption that each of the two gluten quality parameters capture different aspects of the technological characteristics of wheat, exhaustive use of only one of them becomes a problem because the assessment leaves out most of the factors that determine quality.
CORRELATION COEFICIENTS IN THE RANGE OF THE PARAMETERS GLUTEN INDEX AND DEFORMATION INDEX The table highlights eight classes of ranges, four corresponding to the gluten index (0-30, 31 -60, 61-80 and 81-100) and four corresponding to the deformation index (0.0 - 6.0 mm, 6.5 - 12.0 mm 12.5 to 20 mm and 20.5 - 40.0 mm). For each of these intervals there were determined correlation coefficients gluten index - the index of deformation and protein content - wet gluten. In the case of values exceeding the limits of 20.5 mm for the deformation index and 81 for gluten index, the correlation between the two parameters becomes insignificant. Correlation between protein content and wet gluten remains highly significant, regardless of the range of variation
Evolution of the correlation coeficients (r) Gluten Index – Deformation index and Protein content – Wet gluten, depending on the ranges of the Gluten Index parameter The value of the correlation coefficient between Gluten Index and the Deformation Index decreases from very significant to insignificant and even changes its sign for gluten index values greater than 81. This trend suggests that at high levels (over 61) the gluten index parameter expresses to a low extent the proteolytic activity of wheat.
Evolution of the correlation coefficients (r) Gluten index - Deformation index and Protein content - Wet gluten, depending on the ranges of the Gluten Index parameter Analysis of correlation coefficients between Gluten Index and the Index of deformation, within the ranges as a function of the Index of deformation, shows that proteolytic activity is not characterized by both parameters to the same extent. Thus, at high levels of Deformation Index, the correlation between parameters becomes insignificant.
Evolution of the variation coefficients depending on the ranges of the parameter Deformation index Moreover, small variations of the deformation index correspond to high variations of gluten index (90% over the range 20.5 - 40 mm). The coefficients of variation associated to the deformation index tend to decline as the value of this parameter increases. Consequently, this parameter more accurately describes the effects of the proteolytic activity on gluten.
CONCLUSIONS • The deformation index and gluten index, are not interchangeable in evaluating the quality of wheat. Although there is a very significant correlation between the two parameters, the coefficient of determination is low. The phenomenon is especially pronounced for extreme values - superior to their range of variation. • The wheat quality evaluation should include both quality parameters, because none of them covers all aspects of gluten quality. The deformation index seems more appropriate for the assessment of the proteolytic activity (phenotypically influenced) and gluten index seems more appropriate to evaluate the overall quality of gluten (genotype + phenotypic influences).
BIBLIOGRAPHY Popa, N.C., Tamba-Berehoiu Radiana, Popescu Stela (2008): Main quality parameters’ evolution of the wheat cultivated in Romania during the last years, Roumanian Biotechnological Letters Vol. 13, No. 1, pp. 3557-3566. Tabără V., Puşcă I, Wagner L., Pop Georgeta, Niţă Simona, Gorinoiu Simona, Prodan Monica (2008): Baking quality of autumn wheat varieties in terms of the Lovrin research resort, Agir Bulletin no. 1 – 2, January – June. Koppel, Reine, Ingver, Anne (2004): Investigation of components of baking quality of wheat in Estonia, International Workshop on Modelling Quality Traits and their Genetic Variablity for Wheat: A satellite meeting of the VIII ESA Congress, INRA; Clermont-Ferrand, France. 18-21 July. Gaines, C.S., Fregeau Reid, J., Vander Kant, C., Morris, C.F. (2006): Comparision of Methods for Gluten Strenght Assessment, Cereal Chem., 83(3):284-286. Popa, N.C., Tamba – Berehoiu Radiana, Popescu Stela, Varga Mioara, Codină Georgiana Gabriela (2009): Predictive model of the alveografic parameters in flours obtained from Romanian grains, Romanian Biotechnological Letters Vol. 14, No. 2, pp. 4234-4242. Popa, N.C., Tamba – Berehoiu Radiana, Popescu Stela, Tamba S. (2010): Investigations on predictive modelling of the farinographic parameters, Scientific Bulletin Biotechnology, U.S.A.M.V., Bucharest, Serie F, Vol. XIV, p p. 50 – 57. Kostyukovsky, M., Zohar, D. (2004): Sunn Pest Eurygaster integriceps Put. And Wheat Quality in Israel, International Quality Grains Conference Procedings. Rashed, M.A., M.H. Abou-Deif, M.A.A. Sallam, Aida A. Rizkalla, Walaa A. Ramada (2007): Identification and Prediction af the Flour Quality of Bread Wheat gy Gliadin Electrophoresis, Journal of Applied Sciences Research, 3 (11): 1393-1399. Ghencea Sabina (2008): Comparative study on the quality of wheat harvested in 2006 and 2007, News in Milling and Baking Industry, downloaded from http://www.rompan.ro/uploaded_files/file/2008_1_revista.pdf at 27.09.2010.