Download
1 / 1
10 likes | 103 Views
Reflectance (%). plot. %N. 0.5. 1.90. %N. 2.7. NIR reflectance. 0. MODIS albedo (flux tower footprint). 2.2 2.0 1.75 1.50 1.25 1.00 0.75. r 2 =0.71. r 2 =0.53. r 2 =0.82. %N predicted from AVIRIS reflectance at 889nm. %N predicted from MODIS NBAR band 2.

E N D
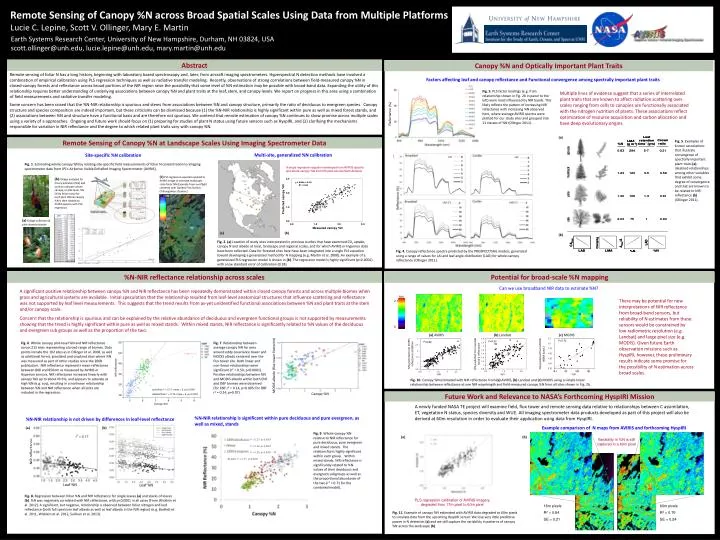
Reflectance (%) plot %N 0.5 1.90 %N 2.7 NIR reflectance 0 MODIS albedo (flux tower footprint) 2.2 2.0 1.75 1.50 1.25 1.00 0.75 r2=0.71 r2=0.53 r2=0.82 %N predicted from AVIRIS reflectance at 889nm %N predicted from MODIS NBAR band 2 %N predicted from Landsat band 4 reflectance Leaf %N Canopy %N %N %N %N 60 50 40 30 20 10 (a) (a) (b) NIR reflectance solid line r2 = 0.71, rmse = 5, p<0.0001 dashed line r2 = 0.74, rmse = 5, p<0.0001 Canopy %N Leaf %N (b) Remote Sensing of Canopy %N across Broad Spatial Scales Using Data from Multiple Platforms Lucie C. Lepine, Scott V. Ollinger, Mary E. Martin Earth Systems Research Center, University of New Hampshire, Durham, NH 03824, USA scott.ollinger@unh.edu, lucie.lepine@unh.edu, mary.martin@unh.edu Abstract Canopy %N and Optically Important Plant Traits Remote sensing of foliar N has a long history, beginning with laboratory based spectroscopy and, later, from aircraft imaging spectrometers. Hyperspectral N detection methods have involved a combination of empirical calibration using PLS regression techniques as well as radiative transfer modeling. Recently, observations of strong correlations between field-measured canopy %N in closed-canopy forests and reflectance across broad portions of the NIR region raise the possibility that some level of %N estimation may be possible with broad-band data. Expanding the utility of this relationship requires better understanding of underlying associations between canopy %N and plant traits at the leaf, stem, and canopy levels. We report on progress in this area using a combination of field measurements and radiative transfer modeling. Some concern has been raised that the %N-NIR relationship is spurious and stems from associations between %N and canopy structure, primarily the ratio of deciduous to evergreen species. Canopy structure and species composition are indeed important, but these criticisms can be dismissed because (1) the %N-NIR relationship is highly significant within pure as well as mixed forest stands, and (2) associations between %N and structure have a functional basis and are therefore not spurious. We contend that remote estimation of canopy %N continues to show promise across multiple scales using a variety of a approaches. Ongoing and future work should focus on (1) preparing for studies of plant N status using future sensors such as HyspIRI, and (2) clarifying the mechanisms responsible for variation in NIR reflectance and the degree to which related plant traits vary with canopy %N. Factors affecting leaf and canopy reflectance and Functional convergence among spectrally important plant traits Fig. 3. PLS factor loadings (e.g. from relationship shown in Fig. 2b in panel to the left) were most influenced by NIR bands. This likely reflects the pattern of increasing NIR reflectance with increasing %N observed here, where average AVIRIS spectra were plotted for our study sites and grouped into 11 classes of %N (Ollinger 2011). Multiple lines of evidence suggest that a series of interrelated plant traits that are known to affect radiation scattering over scales ranging from cells to canopies are functionally associated with the nitrogen nutrition of plants.These associations reflect optimization of resource acquisition and carbon allocation and have deep evolutionary origins. Remote Sensing of Canopy %N at Landscape Scales Using Imaging Spectrometer Data Fig. 5. Examples of known associations that illustrate convergence of spectrally important plant traits (a); idealized relationships among other variables that exhibit some degree of convergence and that are known to be related to NIR reflectance (b) (Ollinger 2011). Multi-site, generalized %N calibration Site-specific %N calibration Fig. 1. Estimating whole canopy %N by relating site-specific field measurements of foliar N concentration to imaging spectrometer data from JPL’s Airborne Visible/InfraRed Imaging Spectrometer (AVIRIS). A single regression equation developed from AVIRIS spectra and whole-canopy %N from155 plots across North America (c)PLS regression equation applied to AVIRIS image to estimate landscape-scale foliar %N (Example from overflight centered over Quebec Flux Station, Chibougamau, Quebec.) (b) Foliage analyzed for N concentration (%N) and used to calculate whole canopy, or plot-level, %N (% by foliar mass) for each plot. Whole canopy %N is then related to AVIRIS spectra with PLS regression. Predicted canopy %N (a) Foliage collection & plot characterization Measured canopy %N (a) (b) Fig. 2. (a) Location of study sites incorporated in previous studies that have examined CO2uptake, canopy N and albedo at local, landscape and regional scales, and for which AVIRIS or Hyperion data have been collected. Data for forested sites here have been integrated into a single PLS equation toward developing a generalized method for N mapping (e.g. Martin et al. 2008). An example of a generalized PLS regression model is shown in (b). The regression model is highly significant (p<0.0001) with a low standard error of calibration (0.18). Fig. 4. Canopy reflectance spectra predicted by the PROSPECT/SAIL models, generated using a range of values for LAI and leaf angle distribution (LAD) for whole-canopy reflectance (Ollinger 2011). %N-NIR reflectance relationship across scales Potential for broad-scale %N mapping Can we use broadband NIR data to estimate %N? A significant positive relationship between canopy %N and NIR reflectance has been repeatedly demonstrated within closed canopy forests and across multiple biomes when grass and agricultural systems are available. Initial speculation that the relationship resulted from leaf-level anatomical structures that influence scattering and reflectance was not supported by leaf level measurements. This suggests that the trend results from as-yet unidentified functional associations between %N and plant traits at the stem and/or canopy scale. Concern that the relationship is spurious and can be explained by the relative abundance of deciduous and evergreen functional groups is not supported by measurements showing that the trend is highly significant within pure as well as mixed stands. Within mixed stands, NIR reflectance is significantly related to %N values of the deciduous and evergreen sub groups as well as the proportion of the two. There may be potential for new interpretations of NIR reflectance from broad-band sensors, but reliability of N estimates from these sensors would be constrained by low radiometric resolution (e.g. Landsat) and large pixel size (e.g. MODIS). Given future Earth observation missions such as HyspIRI, however, these preliminary results indicate some promise for the possibility of N estimation across broad scales. (a) AVIRIS (b) Landsat (c) MODIS Fig. 6. Whole canopy, plot-level %N and NIR reflectance across 215 sites representing a broad range of biomes. Data points include the 102 sites as in Ollinger et al. 2008, as well as additional forest, grassland and cropland sites where %N was measured as part of other studies since the 2008 publication. NIR reflectance represents mean reflectance between 800 and 850nm as measured by AVIRIS or Hyperion sensors. NIR reflectance increases linearly with canopy %N up to about N=3%, and appears to saturate at high %N (e.g. soy), resulting in a nonlinear relationship between %N and NIR reflectance when all plots are included in the regression. Fig. 7. Relationship between average canopy %N for area around eddy covariance tower and MODIS albedo centered over the flux tower site. Both linear and non-linear relationships were significant (r2 = 0.50, p<0.0001). Positive relationships between %N and MODIS albedo within both ENF and DBF biomes were observed (for ENF r2 = 0.14, p=0.005; for DBF r2 = 0.24, p=0.07). 0.5 1 1.5 2 Fig. 10. Canopy %N estimated with NIR reflectance from (a) AVIRIS, (b) Landsat and (c) MODIS using a simple linear relationship between reflectance at one NIR wavelength and field-measured canopy %N from all sites shown in Fig. 2b. r2 = 0.27 p<0.0001 Future Work and Relevance to NASA’s Forthcoming HyspIRI Mission r2 = 0.42, p<0.0001 r2 = 0.35, p<0.0001 A newly funded NASA TE project will examine field, flux tower and remote sensing data relative to relationships between C assimilation, ET, vegetation N status, species diversity and WUE. All imaging spectrometer data products developed as part of this project will also be derived at 60m resolution in order to evaluate their application using data from HyspIRI. All data: r2 = 0.71, p<0.0001 %N-NIR relationship is significant within pure deciduous and pure evergreen, as well as mixed, stands %N-NIR relationship is not driven by differences in leaf-level reflectance Example comparison of N maps from AVIRIS and forthcoming HyspIRI Fig. 9. Whole-canopy %N relative to NIR reflectance for pure deciduous, pure evergreen and mixed stands. The relationship is highly significant within each group. Within mixed stands, NIR reflectance is significantly related to %N values of their deciduous and evergreen subgroups as well as the proportional abundance of the two (r2 = 0.71 for the combined model). (a) (b) Variability in %N is still captured in a 60m pixel Fig. 8. Regression between foliar %N and NIR reflectance for single leaves (a) and stacks of leaves (b). %N was negatively correlated with NIR reflectance, with p<0.0001 in all cases (From Wicklein et al. 2012). A significant, but negative, relationship is observed between foliar nitrogen and leaf reflectance (both full spectrum leaf albedo as well as leaf albedo in the NIR region) (e.g. Bartlett et al. 2011, Wicklein et al. 2012, Sullivan et al. 2013). PLS regression calibration of AVIRIS imagery degraded from 17m pixel to 60m pixel 18m pixels R2 = 0.84 SE = 0.21 60m pixels R2 = 0.76 SE = 0.24 Fig. 11. Example of canopy %N estimated with AVIRIS data degraded to 60m pixels to simulate data from the upcoming HyspIRI sensor. We lose very little predictive power in N detection (a) and we still capture the variability in patterns of canopy %N across the landscape (b).