Download
1 / 18
180 likes | 412 Views
Spatial variation of wind speeds between sites. Andrew Quinn. Why consider wind?. Many problems require a knowledge of the natural environment Design and construction, Transport risk analysis Pollution control, Pollen and aphid movement Wind Power, Forestry management, etc etc

E N D
Spatial variation of wind speeds between sites Andrew Quinn
Why consider wind? • Many problems require a knowledge of the natural environment • Design and construction, Transport risk analysis • Pollution control, Pollen and aphid movement • Wind Power, Forestry management, etc etc • Some require single design values • Others require distributions
Wind speed distribution • How does this change with site? Data from Shap Meteorological site, hourly maximum gust 4/1994 – 3/2003
General form of the CDF • Weibull distribution • Where c and k are site specific constants • Fits both mean hourly data and “gust” data
Extreme value analysis • Majority of previous studies • Typical approach is to take linear approximation to the tail of the distribution • Where LHS is known as reduced variate
Gumbel plot Data from Shap meteorological site - hourly mean and gust up to 1 year return period
Such approaches require long data sets Therefore not local to sites of interest Peak values Gumbel plot of Shap gust extrapolated to 50-year return period Extreme value analysis Shap data hourly mean and gust up to 1 year return period
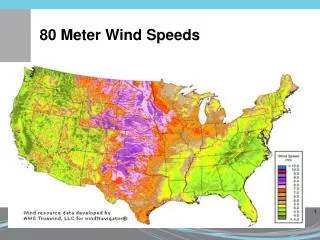
Miller et al (1998) Fig. 5. Estimated 50-year return hourly-mean wind speed for the United Kingdom. Values given in m/s. Design wind speed methodsfor dealing with spatial effects • Wind Speed map methods • BS6399:Part2, Eurocode 1, ESDU • “Wind Atlas” method After Abild et al (1992)
Objective • Obtain a wind speed distribution for a site: • Objective (no subjective estimates of parameters) • Realistic (rather than a conservative design value) • Based on short-term data records • Consistent with other methods (EVA)
Approach • Consider the wind distribution at two sites • Where cA and kA known (from long records) • Define UB+ such that
Approach • For consistency with standard EVA where assume kA = kB (i.e. distributions same shape) • General form E(UB+) ≈ E(γUA)
9 years data 3 months (winter) data Evaluating γ from short term records using ranked simultaneous data
Solution • Thus we know • Long term wind speed probability distribution from a reference site • Can calculate expected wind speed & return period • Relationship between two sites • Objective • Realistic • Small data set
Conclusions • Method for objective, realistic estimates based on short term site data • Data from 8 sites used and estimates for hourly mean and gust wind speeds • Accuracy level similar to direct MO records • Wind direction can be a significant factor
Spatial variation of wind speeds between sites Acknowledgements Roger Hoxey, Chris Hampson, Nick Teer and the other members of the project team at SRI Russell Pottrill, William Bradbury and David Deaves (Atkins)