Download
1 / 17
170 likes | 325 Views
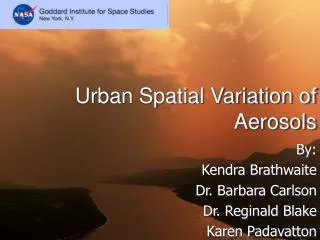
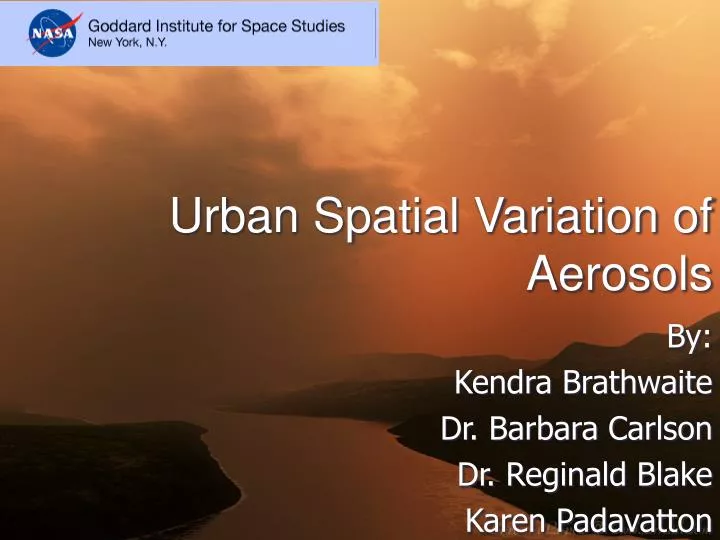
Urban Spatial Variation of Aerosols. By: Kendra Brathwaite Dr. Barbara Carlson Dr. Reginald Blake Karen Padavatton. Introduction.

E N D
Urban Spatial Variation of Aerosols By: Kendra Brathwaite Dr. Barbara Carlson Dr. Reginald Blake Karen Padavatton
Introduction The purpose of this project is to form a connection between the increase of aerosols in the atmosphere with the increase or large amount of individuals that have asthma. We picked at least four different areas in Manhattan that is near the NASA GISS (Goddard Institute for Space Studies ) and we made measurements with the sun photometer to find the amount of aerosols in the atmosphere. We went to several areas, located by zip code, that had a high and low percentage of individuals that had asthma. We found out this information through a survey done previously by other researchers. An aerosol study of New York City has been done to look at the spatial distribution of aerosols in the city instead of in just one specific location. We have used a sun photometer to conduct such research. By using the sun photometer in different areas of the city, we will also try to discover if the areas with a greater amount of aerosols have a greater effect on causing individuals to start developing the many signs or conditions of asthma. Aerosols from the surface can cause serious health complications because of their impact on he quality of the air.
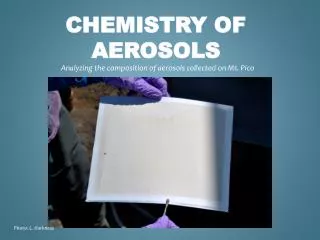
What areAerosols? • Aerosols are small particles that suspended in the Earth’s atmosphere • Aerosol particles can cause a natural haze in the troposphere. • Aerosols can be washed out of the Earth’s atmosphere by rain or some type of precipitation (hail, snow, etc…). • Aerosols can cause acid rain by possibly lowering the pH level of the rain. • Aerosols are known to scatter sunlight. • They can block considerable sunlight which causes cooling effect on the Earth’s climate.
Source of Aerosols • Aerosols originate from volcanoes, forest and grassland fire, living vegetation, and dust storms. • Aerosols also come from human activities such as the burning of fossil fuels and agriculture.
Examples of Aerosols • Dust • Smoke • Bacteria • Salt • Pollen • Carbon Monoxide (CO) • Nitrogen Dioxide (NO2) • Smog (Ozone) • Particulate Matter (PM 2.5 & PM 10) • Asbestos (.PDF) • Tiny droplets of water • Black Carbon
What is asthma? • A serious health disease, caused mostly by allergens,that affects the respiratory system. • It causes a sudden attack of difficulty breathing, the constriction of the chest, coughing and wheezing.
Causes of Asthma • Pollutants • Wood dust • Smoke • Irritants • Chemicals • Viral infections • Bacteria
Xc,vm,.xcm.vm,xcmv,cmx,vm,ç≈µ√≤≈çµ√≤µ≈ç≤√µ≤≥≈çµ√≤µ≈ç√µ,çµ√≤≥µXc,vm,.xcm.vm,xcmv,cmx,vm,ç≈µ√≤≈çµ√≤µ≈ç≤√µ≤≥≈çµ√≤µ≈ç√µ,çµ√≤≥µ
Results From the historical data found, we have found out that the Bronx is the area that is the most polluted borough in New York City with PM2.5. When looking at different many individuals in the Bronx that have asthma or asthmatic symptoms. Another two areas in New York City that are highly polluted are Upper-Manhattan and Mid-Manhattan. It can also be proven by survey that the individuals in the areas could have been affected by the airborne pollutant, PM2.5 ,which can cause people to have asthma.
On day 1, the optical depth in the A.M. is lower than the optical depth of the P.M. This means that in the A.M., there were less aerosols present in the atmosphere. Eventually as the day progressed, the amount of aerosols increased causing the sky to start getting a natural haze.
On day 2, the optical depth in the A.M. is higher than the optical depth of the P.M..This basically means that in the A.M., there were more aerosols present in the atmosphere. Eventually as the day progressed, the skies became clearer and their wasn’t as many aerosols present in the atmosphere.
Conclusion It can be concluded that individuals are at a high risk of getting asthma in New York City due to the spatial distribution of aerosols.
Future Work To extend this project is to take more measurements at different sites around the city and even outside the city so that we can update the information that is available now. By doing this we can learn more about aerosols and really discover whether or not cities or urban areas are really sinks or sources of aerosols and whether cities accelerate the onset or the increases in cases of asthma.
Acknowledgements • NASA GISS (Goddard Institute for Space Studies) Center • Dr. Barbara Carlson • Dr. Reginald Blake • Ms. Laura Hatten: mentor for SHARP students • New York City College of Technology- CUNY • Medgar Evers College- CUNY • NASA SHARP (Summer High School Apprenticeship Research Program) • EPA (Environmental Protection Agency) website • NY DEC (New York State Department of Environmental Conservation)