Download
1 / 32
320 likes | 326 Views
This model predicts the bioaccumulation of PCBs in the food web of San Francisco Bay, including concentrations in seals, bird eggs, sport fish, and prey species. It can be used to assess biological effect levels and human health risks.

E N D
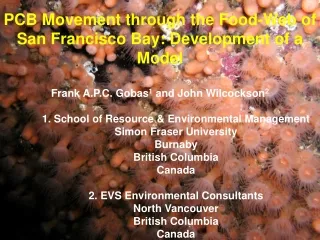
A Model of the Food-Web Bioaccumulation of PCBs in San Francisco Bay • Frank A.P.C. Gobas and Jon A. Arnot • School of Resource & Environmental Management • Simon Fraser University • Burnaby • British Columbia • Canada
Biological effect levels in seals, bird eggs Human Health Risk levels End-Point Concentrations in higher trophic species Concentrations in sport fish Concentrations in prey species (food-web) Target Levels, criteria Concentrations in Water & Sediment Acceptable loadings Loadings
Biota Sediment Accumulation Factor (BSAF) BSAF = CB / CS Sediment
Csediment Cbiota SFB Food-Web Bioaccumulation Model Input Model Output Cbiota=BSAFx Csediment Log Cbiota=log BSAF+ log Csediment
Csediment Cbiota SFB Food-Web Bioaccumulation Model
BSAF predicted BSAF observed BSAF predicted,i n ) / n Log ( BSAF observed,i i=1 Model Performance Analysis Model Bias (MB) = 10
Model Uncertainty Analysis 1. Monitoring data 2. Stochastic Analysis : Monte Carlo Simulations
Congener Specific Calculation Cs, PCB congener 1 Cb, PCB congener 1 Cs, PCB congener 2 Cb, PCB congener 2 Cs, PCB congener 3 Cb, PCB congener 3 * * + Csediment, PCB Cbiota, PCB
Results: Results: Model Performance Analysis - PCB
SFB Food-Web Bioaccumulation Model Model Application Forwards Calculation = +
Distributions of PCB concentrations in sediments in the Northern (blue line), Southern (red line) and Central (green line) sections of San Francisco Bay as well as the distribution for the entire Bay (black line) based on a total of 1,284 samples collected at RMP stations between 1999 and 2001.
Threshold Effect Concentration: Immunotoxicity (Kannan et al. 2000)
SFB Food-Web Bioaccumulation Model Model Application Backwards Calculation = -
Brown : Current Concentration in Sediment Green : Based on NOAEL Red: Based on LOAEL Blue: Based on Threshold Effect Concentration Grey: Based on human health hazard (H=1) Black: Based Upperbound estimate of 1:100,000 excess life time cancer risk in SFB fish eating humans Yellow : Based on 5% exceedence of the threshold effect concentration
Conclusions Developed and constructed a food-web bioaccumulation model of PCBs for San Francisco Bay (Excel spreadsheet). Tested the model against empirical field data. Model Bias among species ranged between 0.83 and 1.35 (for PCB congeners) and 0.73 and 1.19 (for PCB). Ideal =1. Range of model predicted BSAFs that include 95% of the observed BSAF values ranges between a factor of 2 to 4 of the mean depending on the species. The model can be used to set Bay-widetarget PCB concentrations for the sediment of San Francisco Bay. The model can be further developed to make more spatially explicit calculations of the relationship between PCB concentrations in sediments and biota when information on migrations routes and corresponding sediment concentrations become available.
We thank the many people who have helped us to bring all the information together for the development of the model.
SFB Food-Web Bioaccumulation Model Model Application Forwards Calculation = +
Results: Model Performance Analysis PCB congenersPCB
Model for uptake, elimination & bioaccumulation of PCBs in organisms other than phytoplankton & algae
Gw.Ew.Cw + Gd.Ed.Cd Cb = Gw.Ew + Gf.Ed + Vb (km +kg) Kbw Kbf Model Calculations
Mineralization OC Z f Algae,Macro-phytes 26% 1 1 Suspended solids 4% 0.15 6.5 Bottom sediments 1.5% 0.058 17.3